You are here
Coronavirus Research at a Glance
Your laboratory studies multi-agent systems (social media, insect colonies, neural networks, traffic jams, etc.) in which the interaction of crowds produces a well-organised overall behaviour. Among these systems, you have taken an interest in researchers and their scientific production, and in particular made interactive maps for coronavirus research available to the public.1 What exactly is involved?
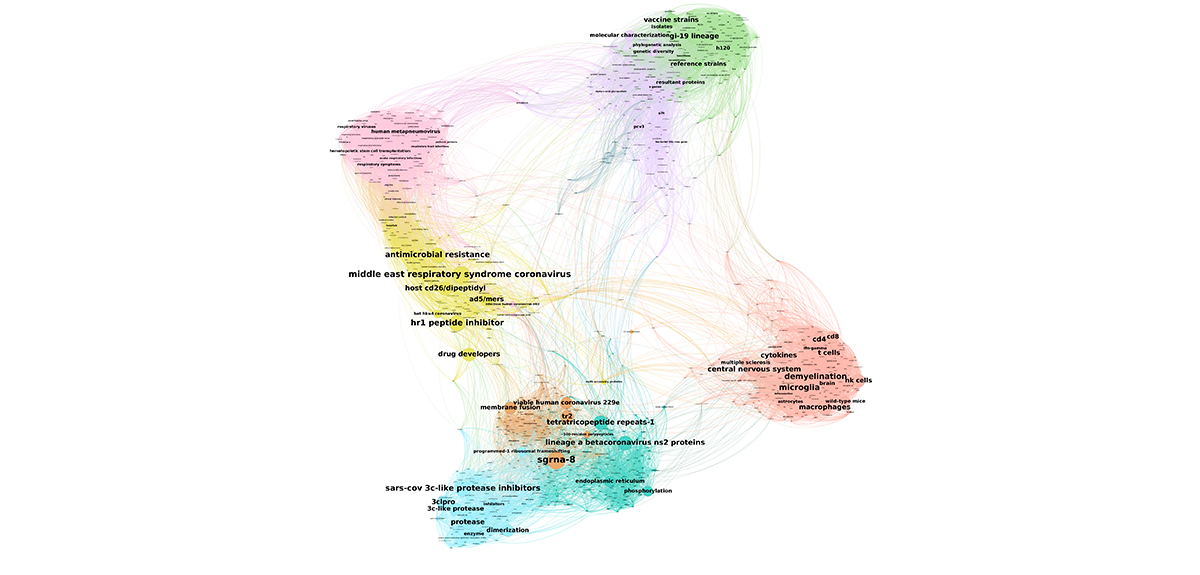
David Chavalarias:2 Faced with the Covid-19 epidemic, we wanted to put our expertise in data science at the service of researchers working on the virus. As in any discipline, these scientists have access to the huge mass of data that is available in scientific papers, but in which it is often difficult to find one’s way around. That is where our cartography comes in: by analysing thousands of articles, it reveals the main themes explored in connection with the virus, as well as how they are organised. It makes it possible to visualise the state of research on a particular subject at a glance. Navigating these maps enables users to directly access the articles relative to a specific question, and be sure not to miss an essential aspect of a given field. This will facilitate the work of researchers, thereby helping to advance research on the virus.
How are these maps constructed?
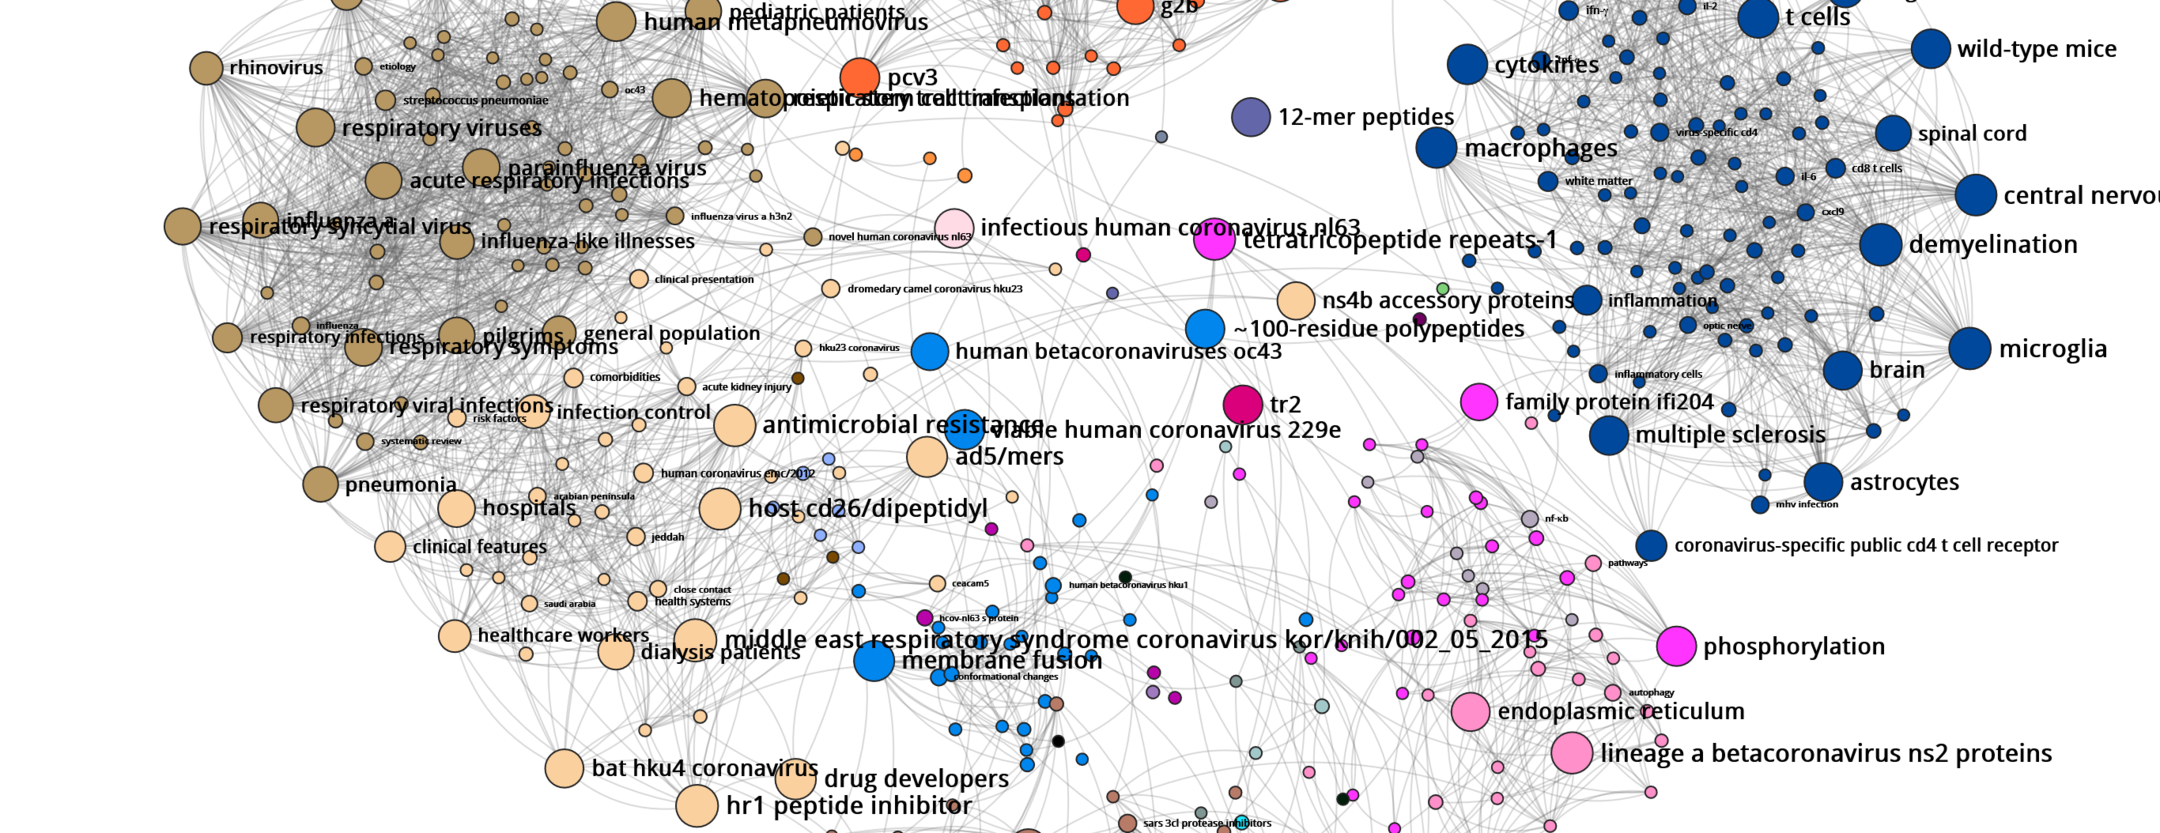
D. C.: They were created using the Gargantext program I have been working on with Alexandre Delanoë since 2013. For the first map, which was produced at the beginning of the epidemic last February, the software analysed the content of more than 6,500 biomedical papers on the coronavirus published between 2000 and 2020. Initially the tool conducted what is known as ‘text mining’ on all of these publications. Using automatic language processing techniques, we extracted the most representative terms from this corpus, namely 2,000 expressions such as ‘effective vaccines’ or ‘SARS’ (Severe Acute Respiratory Syndrome).
Once these keywords were identified, we tried to determine how they were connected, that is to say what is the probability that one of these terms is associated with another by a researcher in an article – in another field, ‘cancer’ has a high chance of being linked with ‘tobacco’, for instance. By measuring this probability for each pair of words in all of the articles, we revealed groups that interacted more actively with one another than with the remainder of the terms studied.
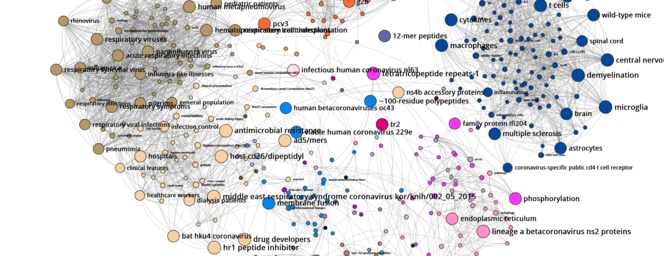
These groups define none other than the major research themes often investigated by specific communities (coronavirus among humans or among pigs, symptoms of the illness, etc.). On the map, in which each dot represents a term – the larger the dot, the more central it is in the network of relations between terms – and where associated words are connected by lines, these communities clearly stand out in the form of clusters of different colours.
What concrete information do they provide?
D. C.: These maps firstly have a bibliographical quality, as they enable researchers to quickly find the important topics and related articles to consult. For example, if a biologist is interested in the antiviral activity of certain substances against the coronavirus, all they have to do is type the term ‘antiviral’ in the search bar, and the map will provide the terms most often associated with it (chloroquine, CH25H, etc.), together with the corresponding articles. This allows scientists to have a precise idea of the most advanced research on a subject, and in certain cases to also identify previously-studied avenues that deserve renewed attention.
The other advantage is that these maps foster collaboration among researchers. By explicitly showing the links between terms used by different communities, they can prompt the scientific community to exchange ideas to move forward. Indeed, groundbreaking discoveries are often made at the interface of disciplines. To this end, on 5 April I produced another map that offers a broad synthesis of research on antivirals, based on 17,000 papers published over the last twenty years. The coronavirus features as one field among others, and the idea is to visualise work being conducted elsewhere (herpes, cancer) to potentially find answers to Covid-19.
Have these maps already led to any important application concerning the Covid-19 crisis?
D. C.: Absolutely. A graph of all the clinical trials for Covid-19 treatments listed by the World Health Organization, which I developed on 11 April, drew interest from the Paris Centre of Research in Epidemiology and Statistics, which hopes to use it for coordinating research. By offering a synthetic view of the avenues explored by past and current clinical trials, the combinations of treatments, and the results obtained or observed, the system will make be possible to explore new leads while avoiding the repetition of similar studies.
Can the general public also make use of such visualisations?
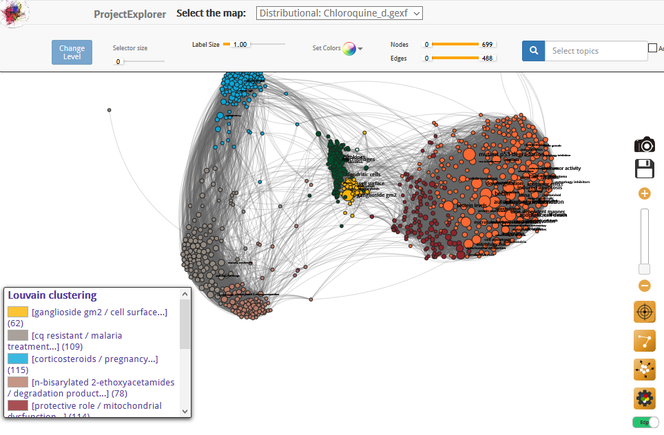
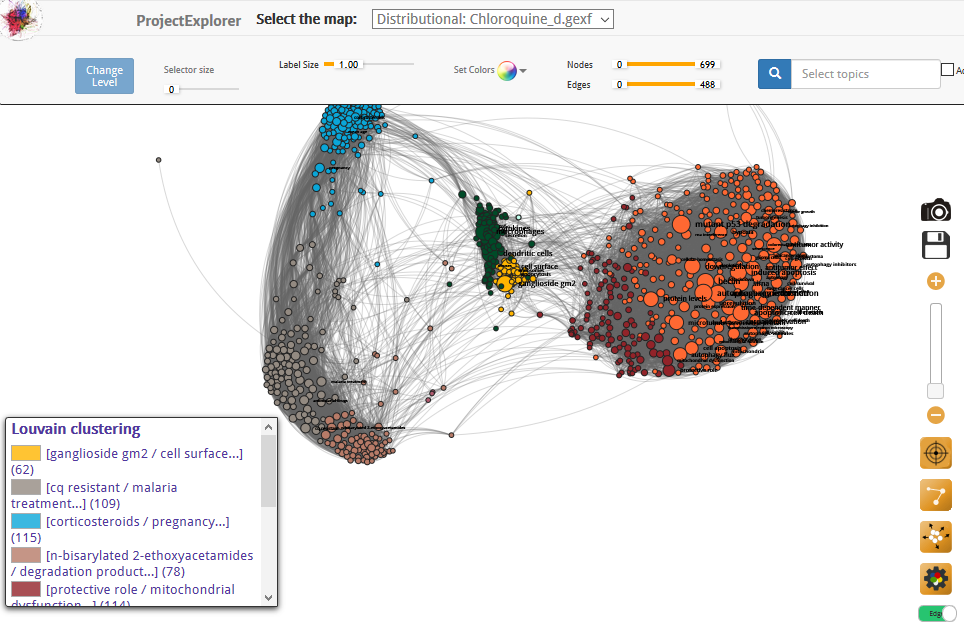
D. C.: Of course. That’s what I tried to show with a fourth map of research on chloroquine, an active ingredient that has long been used especially to treat malaria, and could also prove useful against Covid-19. I made this map in March, when the controversy arose around this drug, which some have accused of being dangerous.
This tool enables even non-experts like myself to get an idea, in light of scientific studies, of the issues surrounding the use of the molecule. A search for the term ‘toxicity’ in this map reveals that the relevant research relates to cardiovascular disorders and eye conditions (retinopathy). Close reading of the publications shows that harmful effects seem to be primarily observed after a long period of use. This of course does not mean that medical opinion on the potential dangers of this medicine is superfluous, but simply that the map helps to gain a better grasp of what the scientific debate is about.
Could your maps have other uses?
D. C.: Indeed, and our objective is for this type of visualisation, which is not yet widespread in science, to become a standard for informing researchers about the key issues in their research. That’s why Gargantext is a free software: anyone can use it to create their own map,3 and not simply for scientific purposes. A number of other applications can be envisaged, such as cartography for the political manifestos of candidates during an election, patents or company websites in connection with technology monitoring.
Furthermore, we are working to make this software a collaborative instrument. The maps will soon be created in groups, with each person providing their expertise by adding more relevant expressions and documents, or on the contrary removing some of them. The idea is to produce, in a genuinely cumulative manner, maps that are not frozen but can evolve and improve depending on the context and scientific production.
- 1. The maps can be viewed at https://iscpif.fr/chavalarias/?p=1712
- 2. CNRS research professor, head of the CNRS Institut des systèmes complexes Paris Ile-de-France.
- 3. Further information is available at https://gargantext.org/


