You are here
Order within disorder

What is disorder? It is not just the state of your colleague's desk, collapsing under three years worth of files, mail, pens, leaflets, and takeaway menus, piling up in precarious balance. Physicists will tell you that disorder is everywhere. It is present in both the price of coffee on the stock exchange and in the folds of the proteins that are behind the diversity of living things. “In a disordered system, each element contributing to the whole has different properties from those of the other components, or can be located in an environment that is different to others,” explains Marc Mézard, the director of the ENS – PSL higher education institution and a specialist in statistical physics.
These include, for example, the particles within a cloud that is constantly changing shape. While sometimes nothing seems to justify the macroscopic behaviour of this cluster of suspended droplets, a multitude of complex interactions on a smaller scale are actually responsible for it. Is this the reflection of an underlying order, a law hidden within the disorder? The study of these interactions is central to the research of the Italian academic Giorgio Parisi, who was awarded the 2021 Nobel Prize in Physics for his discovery of the interaction between disorder and fluctuations in physical systems.
Multifractal analysis: a Russian-doll like signal
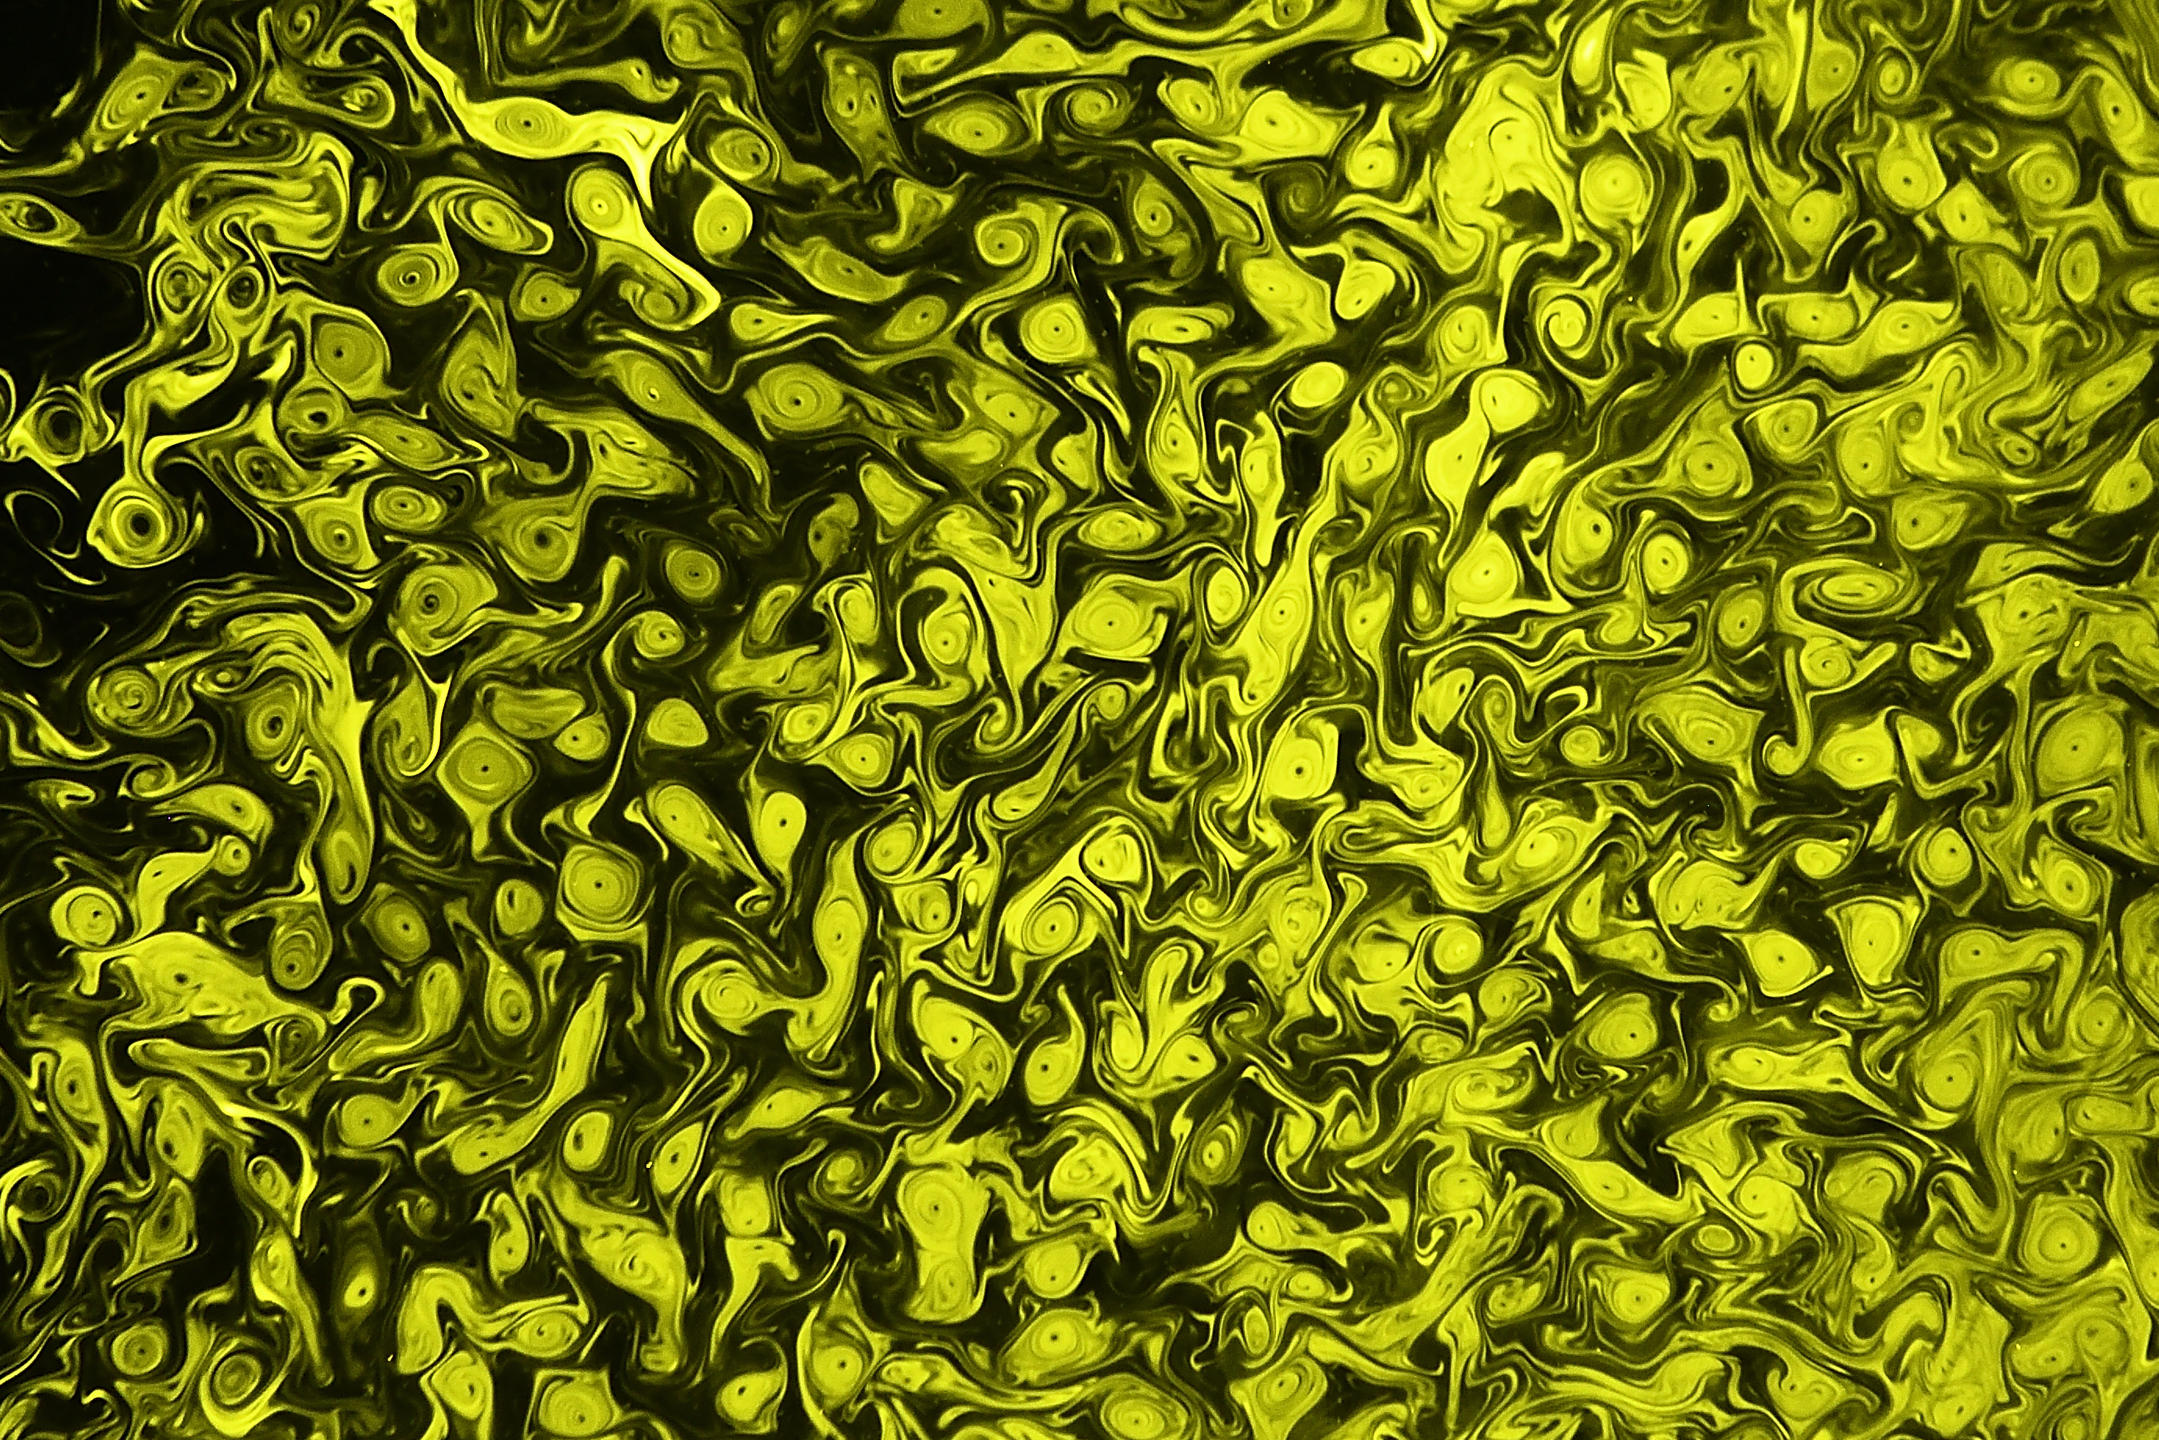
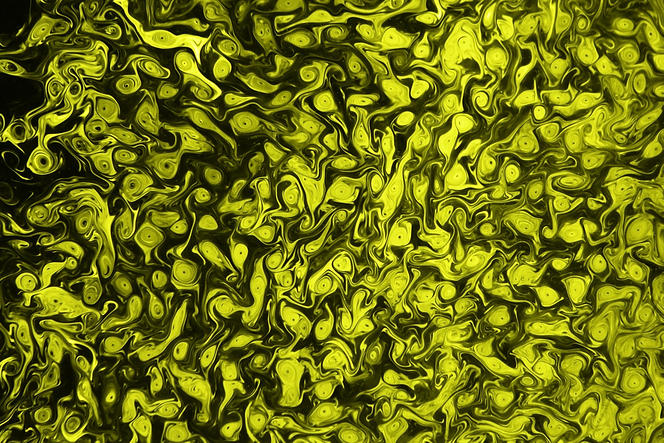
In the 1980s, Parisi and his French colleague Uriel Frisch took an interest in the phenomenon of turbulence,This research follows in particular the cascade models proposed by Benoît Mandelbrot to model turbulence, which were published in 1972. 1 which is characteristic of the movement of fluids. “In a river, it takes the form of eddies of all sizes that appear, disappear, and seem to interact, all while giving an impression of complete disorder,” says Bérengère Dubrulle, a physicist specialising in turbulence at the Condensed Matter Physics (SPEC) laboratory2 who, in collaboration with Mézard, is proposing for the first time a multifractal description to analyse the complexity of the phenomenon.
“Tests in the Modane wind tunnel central eastern France showed that the flow of a turbulent fluid is marked by scale invariance. In other words, the signal is complicated on all scales, although somewhat in the same way each time,” points out Stéphane Jaffard, a professor of mathematics at the LAMA.3 Scientists use the term statistical self-similarity: by zooming into the signal, one can find a similar one. These new tools have paved the way for a whole area of research on turbulence.
Turbulence disrupts climate forecasts
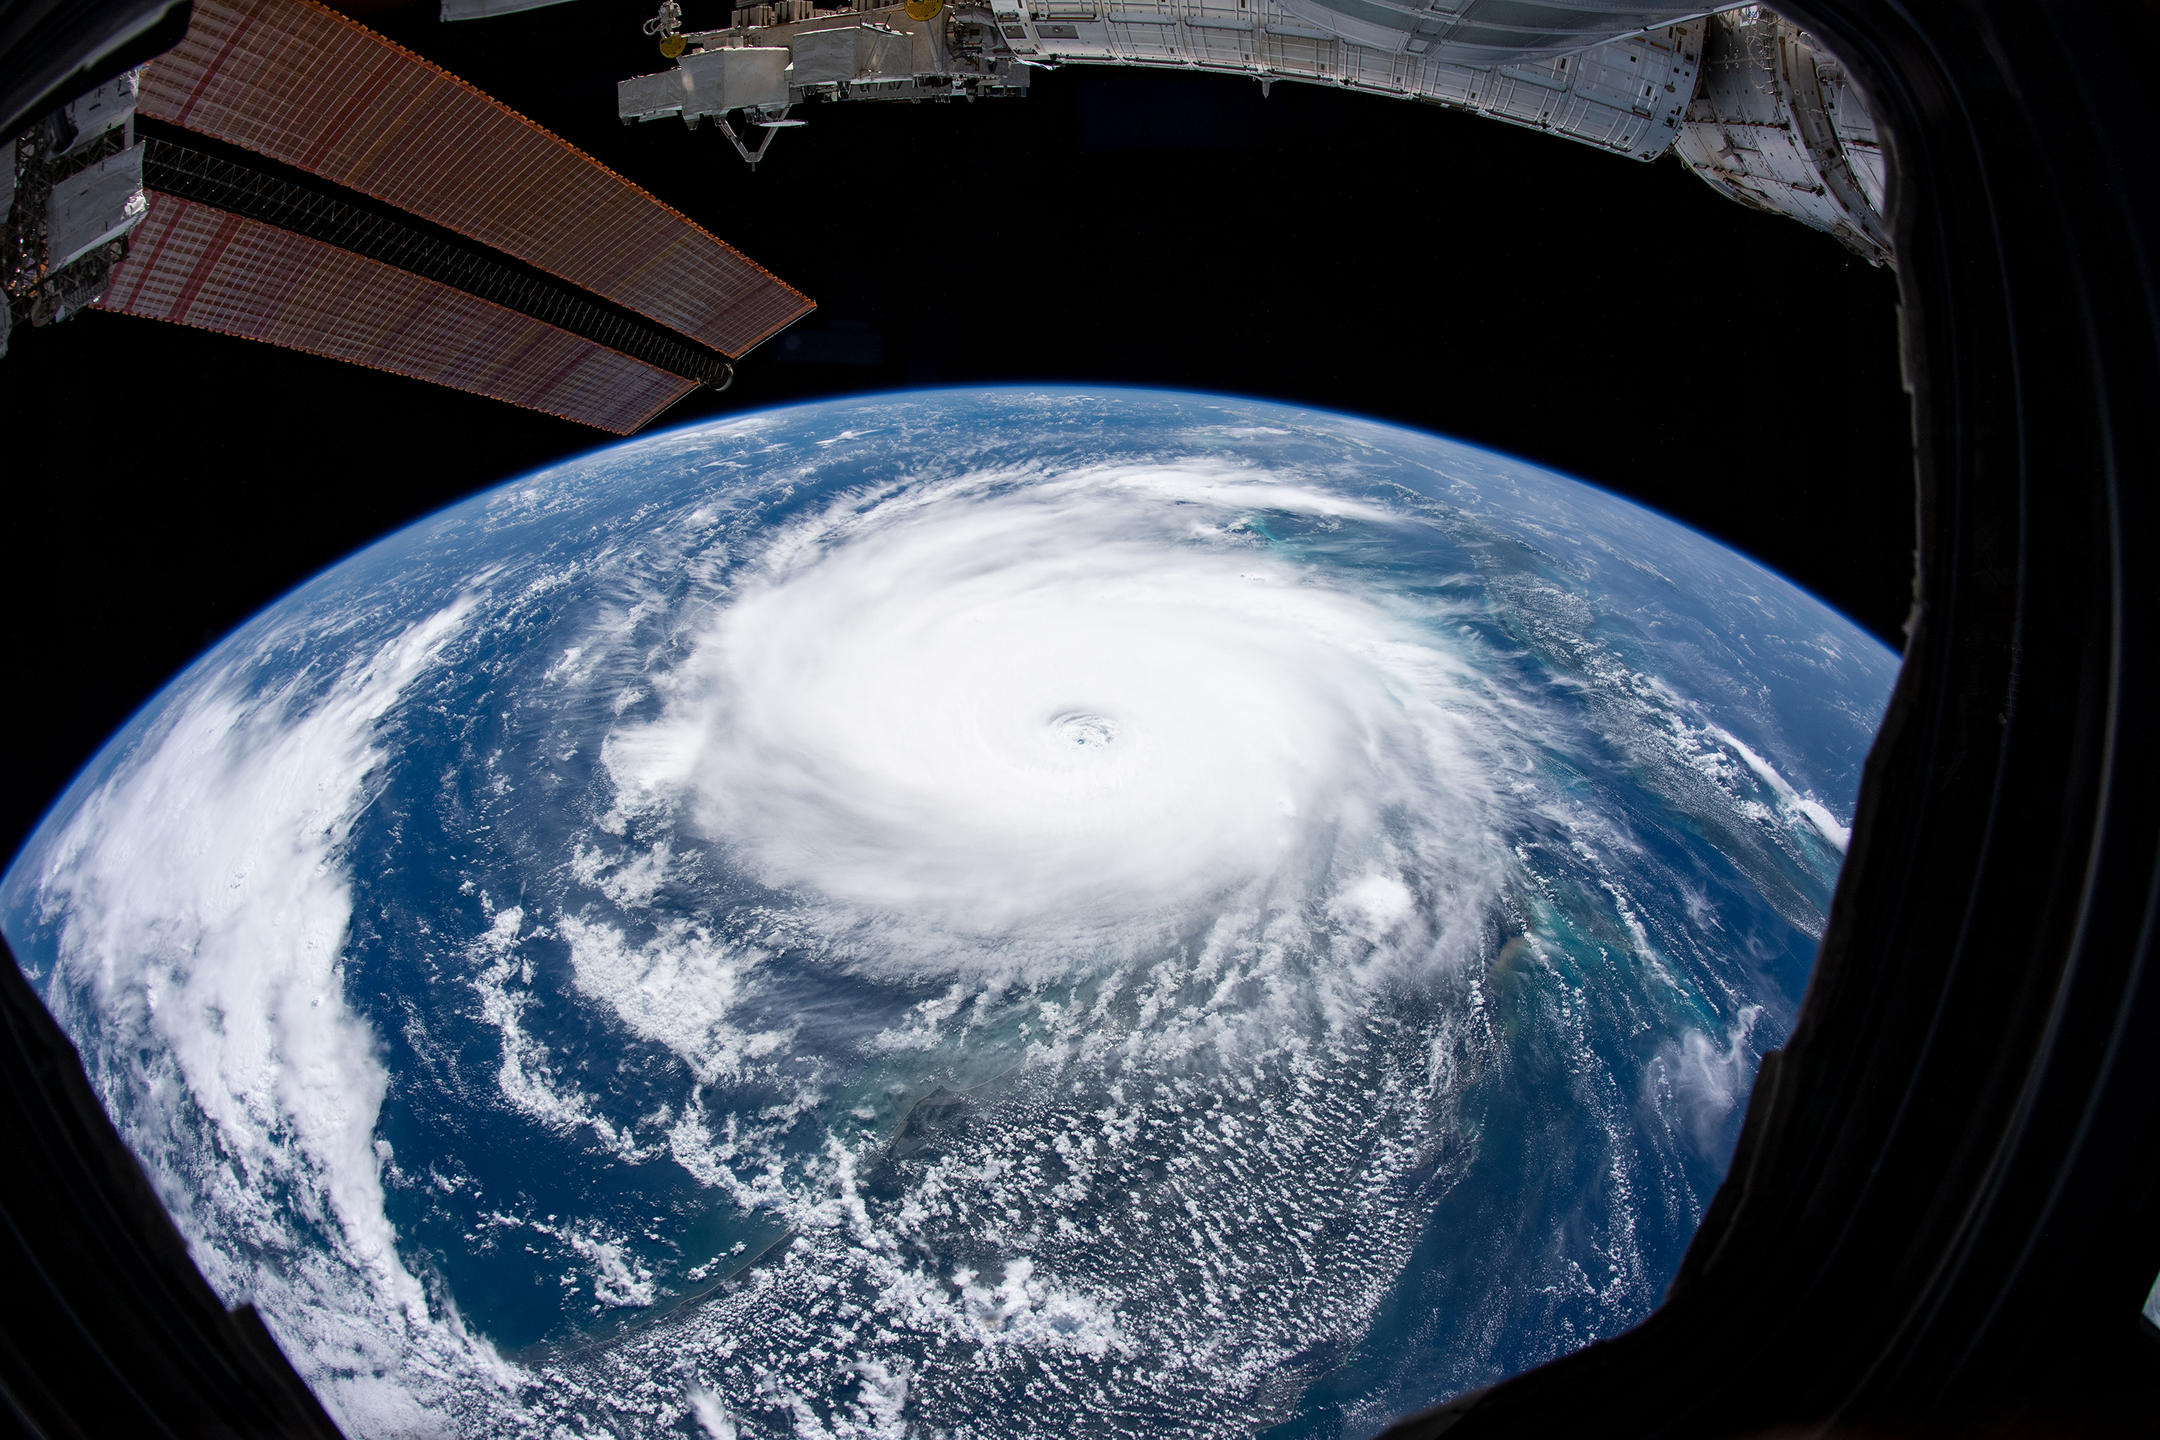
Forty years on, the methods developed by Parisi and his collaborators are still being used to study turbulence. On a large scale, they help grasp the evolution of the climate. “Major atmospheric vortices or ocean eddies do not move very fast, but they have a chaotic property by virtue of which they are highly dependent on initial conditions,” Dubrulle indicates. This is the butterfly effect. Imagine two atmospheres animated by the same distribution of vortices, except for a tiny disruption present in just one of them. Modelling the dynamics of these states will lead to two completely different meteorological situations ten days later.
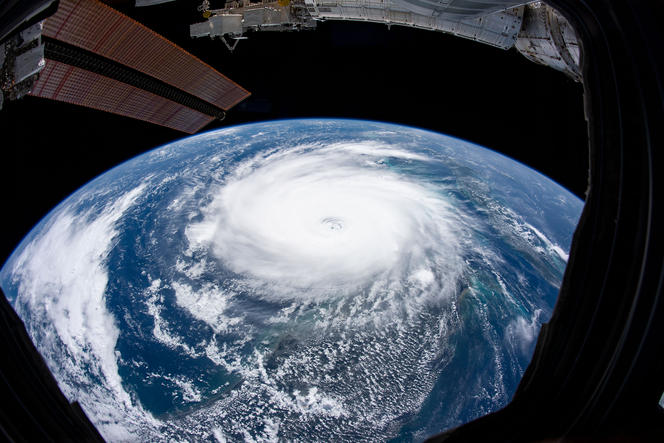
This gives rise to a paradox: it is impossible to predict the weather more than ten days out, even though the Intergovernmental Panel on Climate Change (IPCC)4 is conducting temperature forecasts fifty years ahead. “One can probabilistically say that the summer will be hotter in Toulouse southwestern France than in Brest northwestern France. This prediction is feasible because there is a hidden order within equations for turbulence. On a large timescale, order is restored.” Studies have statistically analysed large-scale circulations of the atmosphere and ocean, and especially how a sudden change over a few years can potentially have a significant impact on the climate.


The analysis of ice cores from Greenland has revealed a series of sudden rises in temperature on the order of 5-6 °C over a decade.5 This is attributed to a change in ocean circulation in the North Atlantic, which is once again slowing today. “We are asking ourselves whether such phenomena could be the signature of a phase transition, similar to that observed in statistical physics when the small variation of a parameter can trigger a drastic modification (such as when water changes from a liquid to a solid state for a mere 1 °C difference),” Dubrulle adds.
Our knowledge on these subjects is advancing, although many questions remain. However, analysis of complexity and disordered systems is not limited to the study of turbulence. The discoveries made since the 1980s have greatly benefitted various disciplines in mathematics and physics.
A similarity that makes waves
Multifractal analysis is now used to study all types of random signals. Jaffard and his collaborators use it for time series analysis of the heart rate.6 These tools help distinguish the signals typical of a healthy person from those of a subject with a heart condition, thereby making it possible to differentiate between various categories. This result garnered attention from unexpected users, such as the Van Gogh Museum in Amsterdam, in the Netherlands. “The curator was looking for image processing tools to detect fake paintings,” Jaffard adds.
Still in the art world, multifractal analysis has also helped classify the important photographic collections of the Museum of Modern Art (MoMA) in New York (US). These include pictures taken by Europeans who immigrated to the United States in the 1930s, although those who took the photographs have not necessarily been identified. To remedy this, a research team including Jaffard proposed a classification based on analysis of the texture of the paper used.
Researchers actually take photographs in low-angled light of the edges and backs of the objects being studied (painting or photography). The characterisation of the texture provides information about the aesthetic intentions and working practices of photographers. “We used wavelet methods that involve breaking down a complex signal to analyse its components on different scales,” Jaffard explains. This multifractal analysis tool7has served a whole variety of purposes since its inception, for it was initially theorised in connection with oil prospecting.
Whether for paintings or photographs, these methods operate in a black box. It is not necessary to understand why they work so well, although more sensitive applications require greater knowledge of the underlying mathematics.
Bone pixels, brain voxels
“We use fractal analysis in concert with random modelling. This is applied to image databases in order to compare them and separate them into categories,” explains Hermine Biermé, a mathematician at Institut Denis Poisson.8 She began her career by studying medical image processing in an effort to improve the diagnosis of osteoporosis, which is usually based on a combination of x-rays and bone density tests to assess the solidity of bones. “The purpose is to differentiate between healthy patients and those suffering from osteoporosis solely based on x-ray images, a test that is affordable and easy to implement.”
These methods were later extended to the analysis of volumes by processing the data from magnetic resonance imaging (MRI). This is a difficult task, for the more dimensions there are, the more random and unknown parameters must be taken into consideration. In this case, the analysis of texture that was used for photographs helps to detect and locate tumour regions within the brain.9 However, not all tumours have a well-defined shape, and they can sometimes spread through a number of anatomical structures, hence making their diagnosis that much more complicated.
Detection involves dissociating healthy brain volumes from those presenting a pathology, a genuine help in diagnosis. And these are not the only achievements of tools from statistical physics.
Finance is like a pile of sand
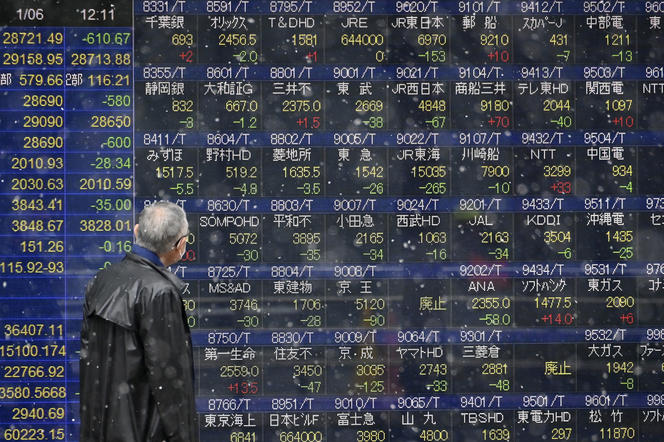
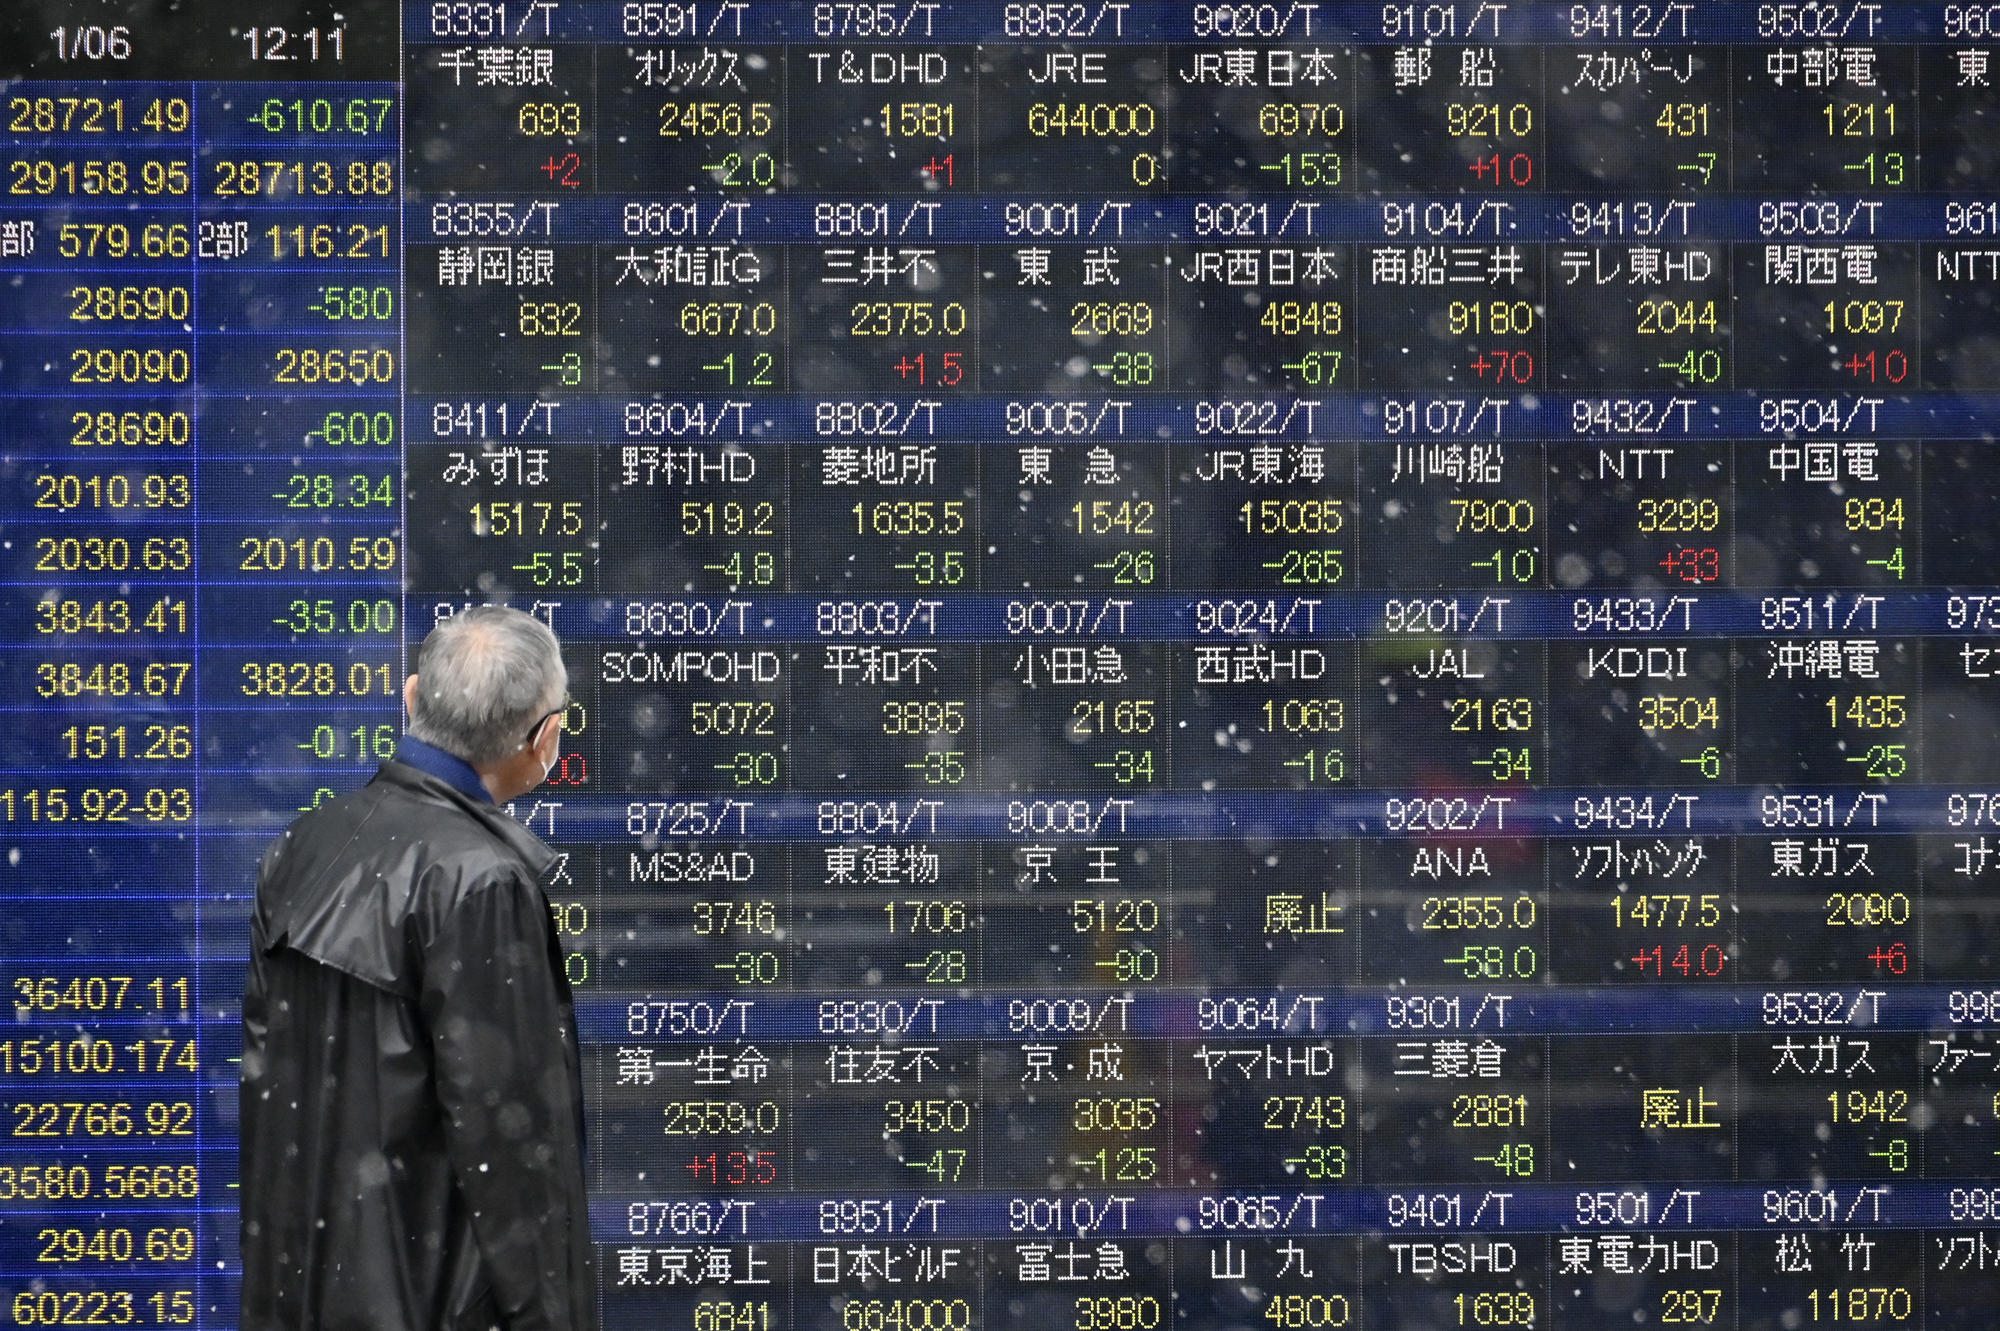
Our journey to the heart of randomness now takes us to the stock exchange. Finance is a complex system in much the same way as meteorology, as small causes can have either major or minor effects across all scales, with no way to determine their scope beforehand. “If you try to identify the event behind a significant change in stock price, you often realise that in most cases, there wasn’t any. The system goes haywire on its own,” describes Jean-Philippe Bouchaud, director of research at Capital Fund Management10 and a specialist in physics applied to economic systems and financial markets. The economic crisis of 2008 is a perfect example. A problem initially limited to the subprime market – a financial product that represented only a small portion of the shares of American banks – caused a collective loss of confidence in the valuation of these products that threatened finance, and in the same breath the real economy.
This is why Bouchaud, who is a member of the French Academy, is particularly interested in endogenous causes, which is to say those specific to the financial system. He believes that the stability of a market is comparable to that of a pile of sand. Randomness is hidden within the catalyst, namely the grain of sand responsible for the dune's collapse. “The key is not so much understanding the catalyst but the feedback loops, in other words the subsequent interactions between market players that lead to a fall in price,” Bouchaud adds. Getting a grasp of this cascade phenomenon would allow us to regulate and stabilise financial systems when they start spinning out of control. It would be possible, as it were, to change the hidden rules as you go along.
The emergence of artificial intelligence tools should provide new opportunities in this field of research. “Machine learning could reveal structures that are invisible to the naked eye, and which we have missed until now. These new elements would enrich existing predictive models.” The irony is that the machine learning methods that could help understand the complexity of finance are also complex systems themselves, which researchers are trying to decipher.
Coming full circle with complexity
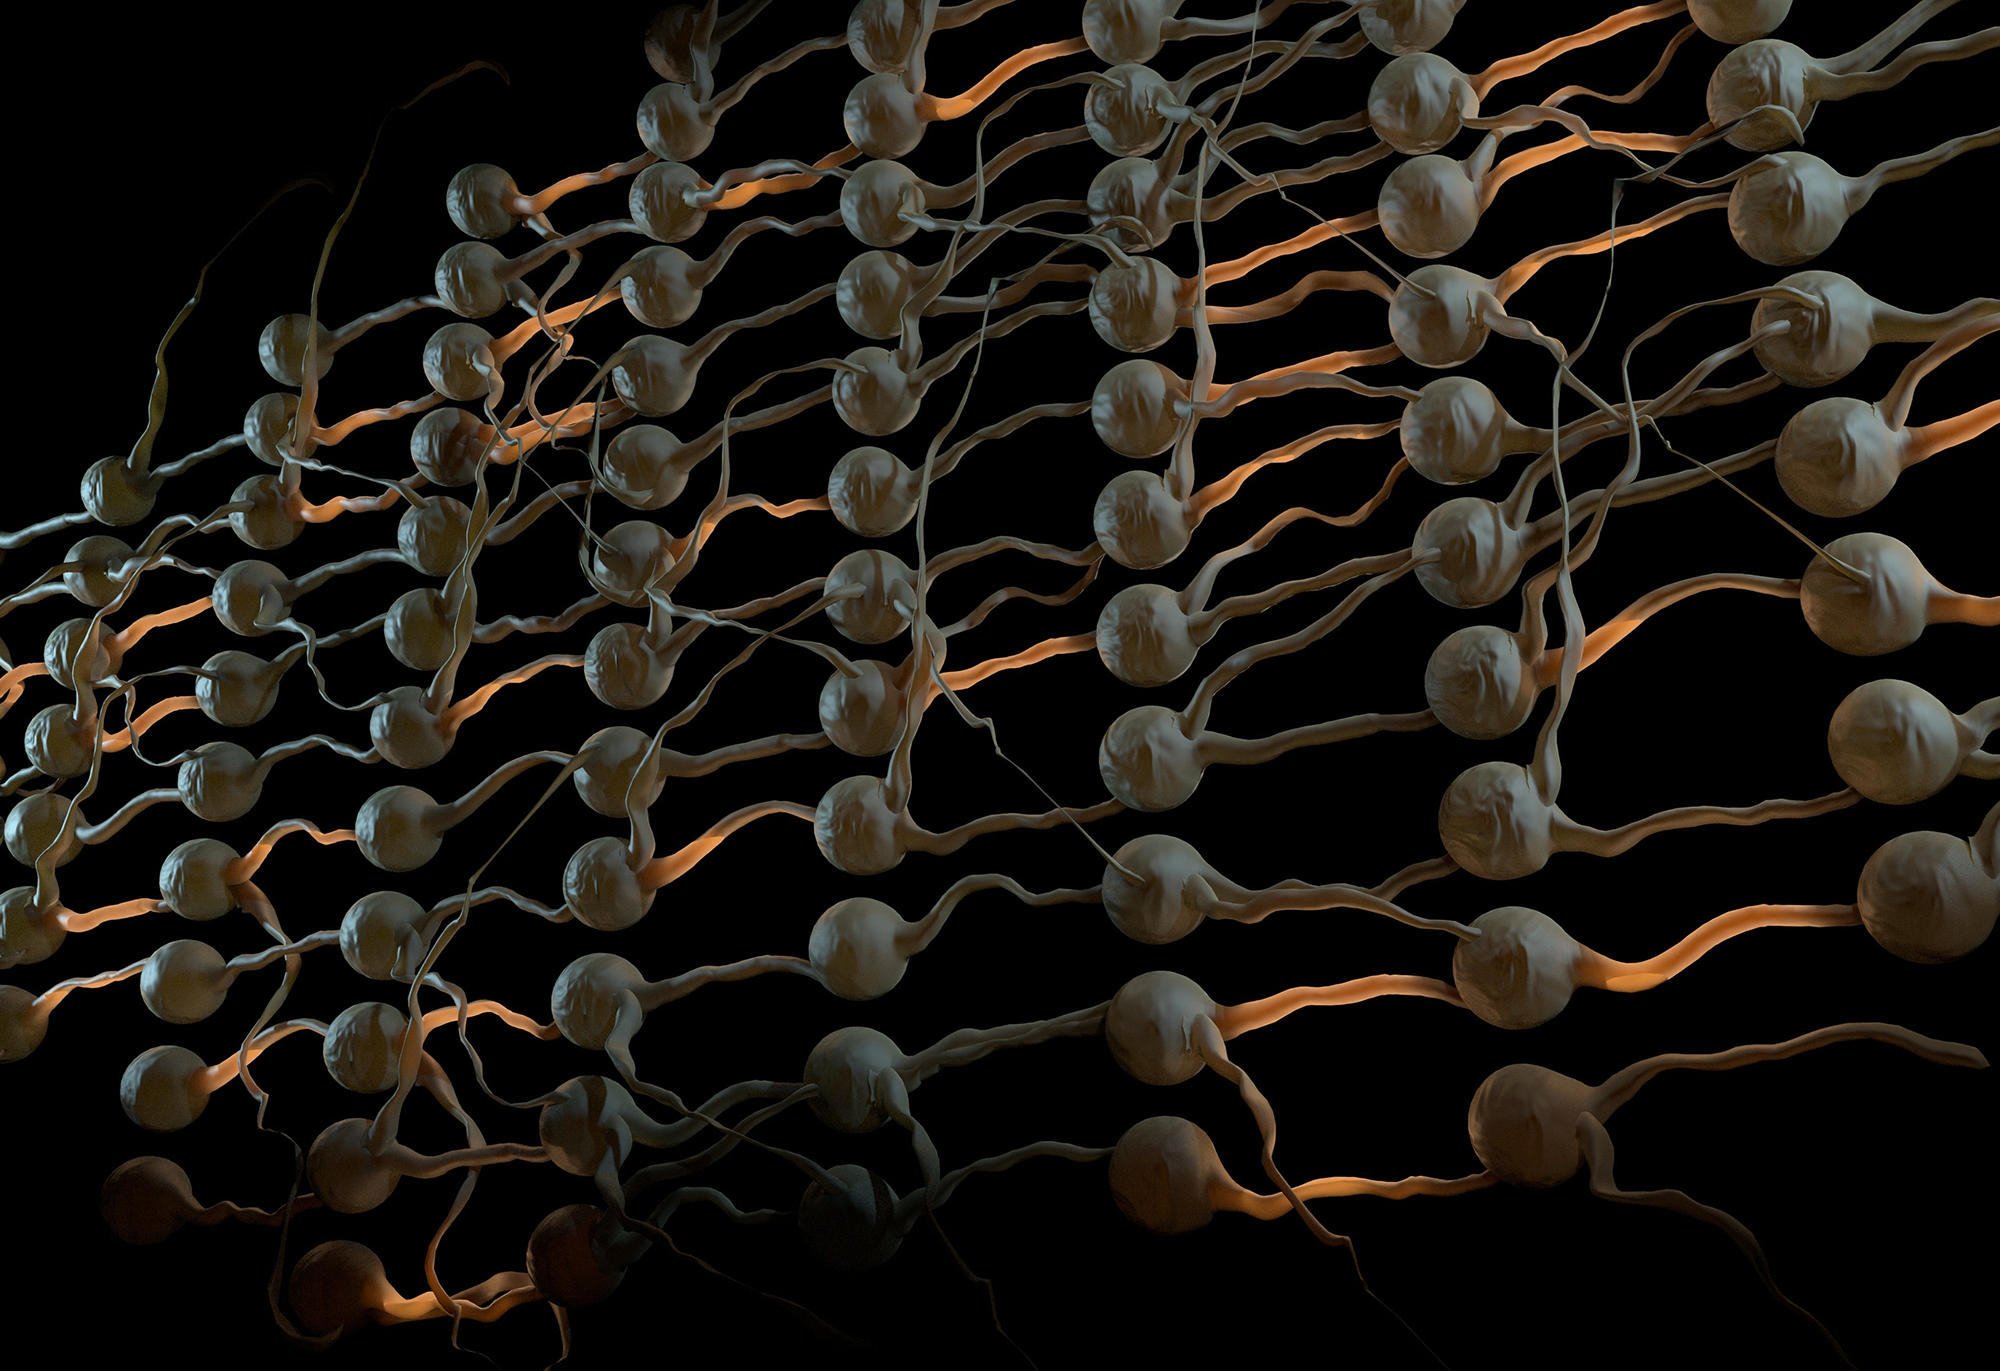
Getting back to the ENS, Marc Mézard is trying to elucidate how learning algorithms function. These artificial intelligence tools have achieved incredible performance, ranging from assistance for medical diagnosis to image recognition. Nevertheless, the ways in which they obtain their results is still poorly understood. Like in a financial system, a network of deep neurons is a very large space consisting of hundreds of thousands of artificial neurons, whose interactions are defined by thousands of adjustable parameters. The learning phase involves finding the value of the parameters that allow an algorithm to perform a specific task, such as classifying faces, identifying a cat, etc.
“The algorithm finds an ideal value for a million parameters, but we do not know what it is doing, how to explain it, how to control it, etc. We have to justify its decisions in order to take its recommendations into account in sensitive practical cases,” Mézard observes. Theory must therefore catch up with practice, which has made giant leaps in the last fifteen years. Perhaps all that is needed is a very simple idea to initiate phenomenal discoveries that could shed light on the highly disordered environment around us.
- 1. This research follows in particular the cascade models proposed by Benoît Mandelbrot to model turbulence, which were published in 1972.
- 2. CNRS / CEA.
- 3. Laboratoire d’analyse et de mathématiques appliquées (CNRS / Université Gustave Eiffel / Université Paris-Est Créteil Val-de-Marne).
- 4. Its Sixth Assessment Report will be completed in 2022: https://www.ipcc.ch/ar6-syr/
- 5. They are known as Dansgaard-Oeschger events. Twenty-five of them have occurred during the last glacial period, with the most recent dating back approximately 12,000 years.
- 6. A time series of the interval between two heartbeats over the course of 24 hours.
- 7. It grew out of an idea from Jean Morlet, a research engineer at Elf Aquitaine in the 1980s, and his collaboration with mathematicians and physicists, such as Yves Meyer and Alain Arneodo.
- 8. CNRS / Université d’Orléans / Université de Tours.
- 9. This research was conducted as part of the I3M joint laboratory between the CNRS, l'université de Poitiers, and the industrial actor Siemens Healthineers SA.
- 10. Private company offering alternative management of financial portfolios, a pioneer in quantitative and systematic investment strategies.
Explore more
Author
After a degree in environmental studies at Paul Sabatier University in Toulouse, then in science journalism at Paris-Diderot University in Paris, Anaïs Culot worked in media relations at the CNRS and now collaborates with various magazines, including CNRS Le Journal, I'MTech and Science & Vie.


