You are here
Mapping the genetic relations between ancient populations

Archaeological sites and museum collections are invaluable not only from a cultural perspective, but also for biological purposes. Indeed, they contain ancestral human DNA, as well as precious elements for retracing the history of humankind and the movements of prehistoric populations. Archaeology and anthropology have long surveyed the evidence of this humanity from the past, and have provided a great deal of data regarding its evolution and connection with today’s societies.
Paleogenomics and bioinformatics have now taken over the analysis of ancient genomes. "Mathematical studies of populations have become an essential complement to biological studies, especially when trying to represent the links between genomes," explains Olivier François, a researcher at the TIMC-Imag1 laboratory. His research, conducted in collaboration with CNRS researcher Flora Jay from the Laboratory for Computer Science (LRI),2 recently featured in Nature Communications.3
Projecting genomes on a map
In order to determine the origins of populations and their evolution, scientists usually generate two-dimensional maps using the ancient DNA samples at their disposal. This process nevertheless suffers from considerable bias due to the random gene frequency change over time (a phenomenon known as genetic drift), and the size of the human communities studied. Mathematical tools have already set to work correcting this problem, but they have an Achilles heel as well. "Principal component analysis (PCA), the mathematical model that is primarily used to establish this kind of map, is based on reference populations. However, the reference genomes are those currently available and are therefore not always representative for studying ancient populations. Their use influences estimates and distorts projections," François adds.

As a result, his most recent research set out to create a mathematical model that does not require a reference. "The goal is to represent, as accurately as possible, individuals and their ancestral relations across both space and time. We modified the method used so as to correct the distortions related to sampling, which improved the quantification of both population structure and admixture rates."
A realistic visualisation of European populations
Scientists applied their new method to the data provided by David Reich's laboratory at Harvard University (US). These elements, which include the genomes of thousands of Eurasian individuals who lived between the Neolithic and the Middle Ages, are crucial in understanding the evolution of prehistoric European populations. The results confirm existing hypotheses, thereby corroborating the accuracy of the mathematical model.
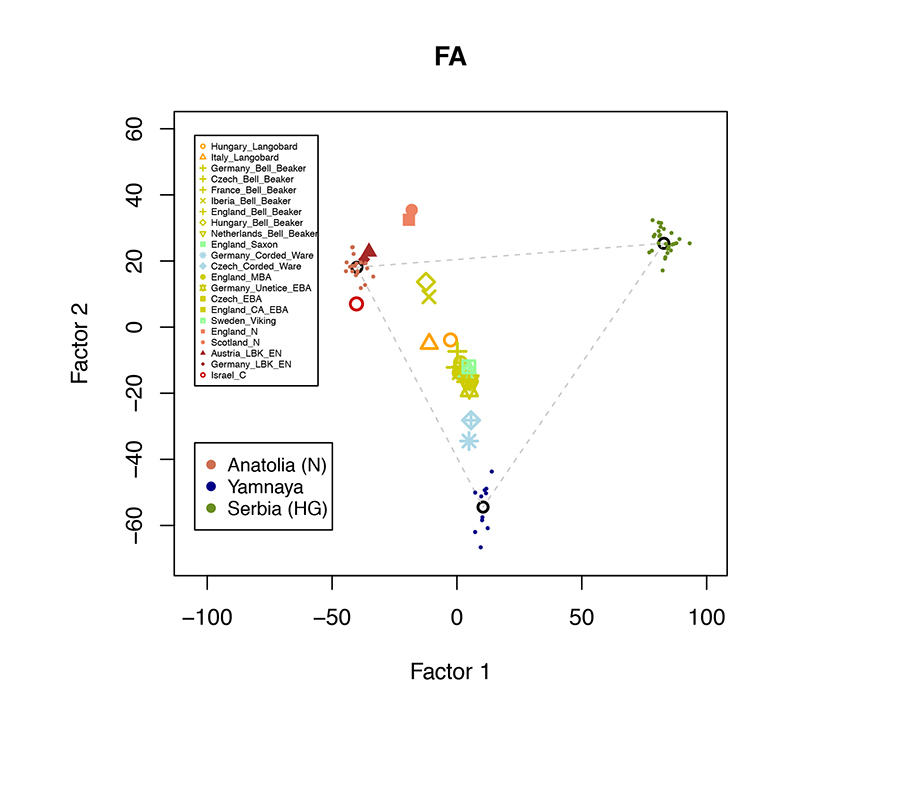
According to the study, the history of European peoples from that period involves contributions from three major distinct groups, which were identified by anthropologists and archaeologists a long time ago. "We generated a map with three extreme points, each of which corresponds to ancestral populations: hunter-gatherers from Serbia, who lived in Western Europe 10,000 years ago; Yamnaya communities from the Pontic Steppe; and finally the first farmers of Anatolia." The ancestors of modern Europeans thus came from the eastern part of the continent, and even from western Asia.
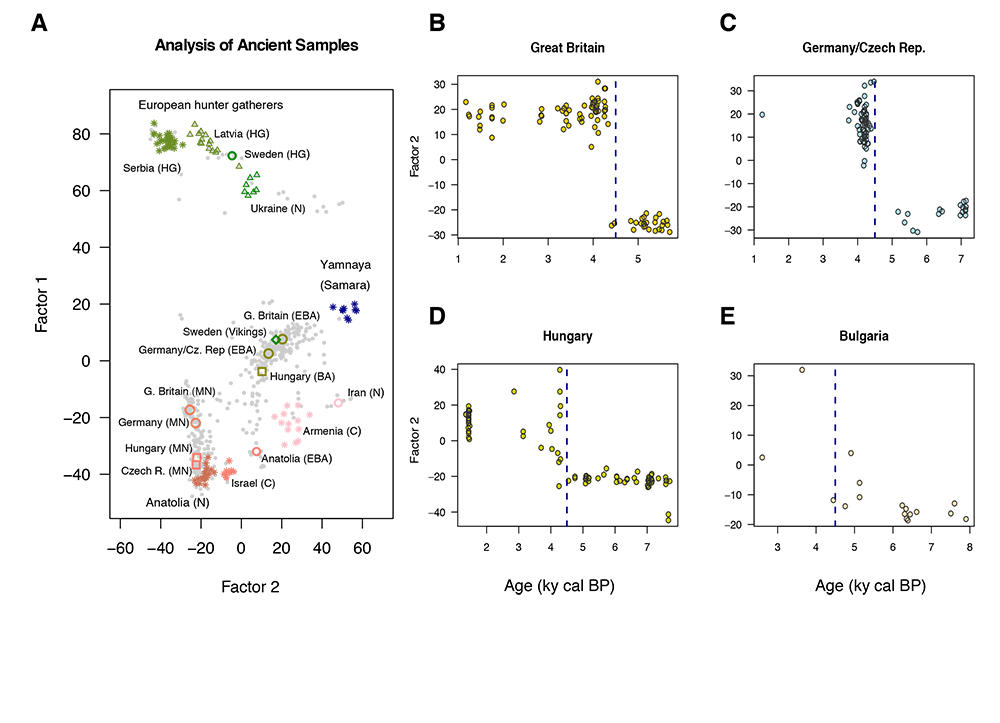
The map produced by these new mathematical tools also confirms the movements of ancestral Yamnaya. "The data shows a massive migration from the Pontic Steppe, which we know took place 4,500 years ago." The study also emphasises that certain more recent European societies have conserved an important part of the genetic heritage of the Yamnaya culture, notably in Scandinavia and the British Isles.
A more precise representation of evolutions
The results reproduce the origins and admixture of these populations with great accuracy, and even reveal details that were previously obscured by genetic drift. The new mathematical method allows for a better estimation and representation of the influences that the three ancestral groups had on more recent peoples. "This map shows that genomes are found between earlier populations, which means there was admixture." These phenomena have affected communities from the Neolithic to the present, ranging from the Vikings to the Armenians and Slavs.

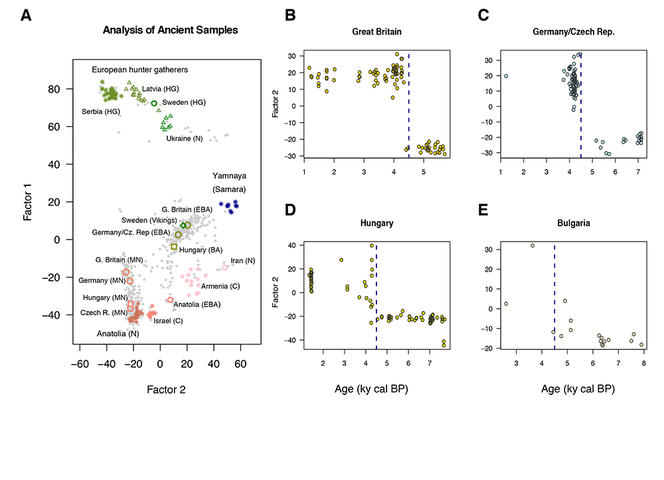
François also notes that his projections are actually less distorted than those obtained using earlier models, thanks to the genome locations on the map: "There is no spatial data whatsoever, but if you look carefully, you’ll see that the distribution of populations in space is preserved on our maps." The genome projection does not exactly match the map of Europe, but it does present a certain spatial logic. Sweden is located above Ukraine, Iran is east of Hungary, and Germany is south of Great Britain. The genetic links between populations can, on their own, position countries.
The potential to study all DNA
This research retraces the history of European populations, but its applications are much broader. "The mathematical tools we developed apply to all possible DNA – and not solely human. The method can be used as long as we have ancient DNA, or a temporal sample of DNA. This makes it possible to study the domestication process of certain animals, such as sheep or horses, which accompanied the invention and development of agriculture." When asked about applications for his model, François points out that mathematical tools can be applied to viruses, a subject that has recently generated a great deal of scientific literature. "With viruses we can speak of ancient DNA after just a few months – a very different time scale to that of humanity."
While there are innumerable objects of study – and just as many research prospects, the scientist is set to continue studying the origins of humanity: "My field of investigation mostly seeks to answer fundamental questions. Who are we? Where do we come from?" Ancient genomes have not yet revealed all their secrets.
- 1. Techniques de l’ingénierie médicale et de la complexité - Informatique, Mathématiques, Applications, Grenoble (CNRS / Université Grenoble-Alpes).
- 2. CNRS / Université Paris-Saclay.
- 3. Olivier François and Flora Jay, "Factor Analysis of Ancient Population Genomic Samples", Nature Communications, vol. 11, article 4661, September 2020. doi: 10.1038/s41467-020-18335-6


