You are here
Change in the Channel
09.16.2016, by
Every fortnight, researchers at the Roscoff Marine Station set sail to chart the evolution of the coastal ecosystem. They take the pulse of a Channel subjected to the effects of climate change and human activities.

1
Slideshow mode
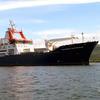
The researchers embark on the Neomysis vessel to collect samples of seawater at two locations serving as reference points, one near the coast and the other off the Isle of Batz.
Wilfried THOMAS/SBR/CNRS Photo Library

2
Slideshow mode
A first series of samples is taken 500 metres from the coast, at the point "Estacade." This natural environment is particularly sensitive to climate change and human activities. The first analyses date back to 1985.
Wilfried THOMAS/SBR/CNRS Photo Library

3
Slideshow mode
In the offshore waters 5 km from the first reference point, the effects of human activities are less pronounced. Measurements taken here are more indicative of changes in the marine environment in the Western Channel, which are associated more particularly with climate change.
Wilfried THOMAS/SBR/CNRS Photo Library

4
Slideshow mode
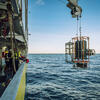
Using a Niskin bottle, the engineers sample seawater both at the surface and at a depth of 60 m.
Wilfried THOMAS/SBR/CNRS Photo Library

5
Slideshow mode
The seawater samples are prepared on board for laboratory analysis. Several biogeochemical parameters will be measured with great precision: salinity, temperature, nutrients, etc.
Wilfried THOMAS/SBR/CNRS Photo Library

6
Slideshow mode
The engineers use a net to take samples of phytoplankton, the concentration and diversity of which act as indicators of the ecological status of this environment.
Wilfried THOMAS/SBR/CNRS Photo Library

7
Slideshow mode
At Roscoff, salinity and temperature have been monitored regularly since 1952. These data provide evidence of long-term changes.
Wilfried THOMAS/SBR/CNRS Photo Library

8
Slideshow mode
In addition to the bimonthly manual data collection operations, automatic sensors have been placed under the “Astan” cardinal buoy located halfway between the coastal and open water sampling points.
Wilfried THOMAS/SBR/CNRS Photo Library

9
Slideshow mode
These sensors measure at high-frequency parameters such as temperature, salinity, dissolved oxygen, pCO2 and fluorescence, with the latter serving as a good indicator of plankton activity.
Wilfried THOMAS/SBR/CNRS Photo Library

10
Slideshow mode
The SOMLIT (Service d’Observation en Milieu LITtoral [Department for Observation of the Coastal Environment]) observation network includes nine other marine stations around the French coastline which carry out bimonthly measurements using the same protocols.
Wilfried THOMAS/SBR/CNRS Photo Library

11
Slideshow mode
All the data acquired are made available in open access (OA) on the Internet, providing researchers around the world with reliable measurements for their studies. A regular temperature increase of several tenths of a degree has been observed since these measurements began.
Wilfried THOMAS/SBR/CNRS Photo Library
Explore more
Life
Article
11/26/2025
Article
11/24/2025
Article
09/24/2025
Article
09/01/2025
Article
08/07/2025
Oceanography
Article
06/27/2023
Article
06/27/2023
Article
07/27/2021
Article
06/08/2021
Article
01/26/2021


