You are here
A Giant Model to Understand Floods
11.24.2015, by
To better predict flood risks, the iCube laboratory has devised an experimental simulation apparatus that mimics extreme flooding in an urban neighborhood. This innovation could help anticipate flooding events like the one that recently affected the French Riviera. In early October, rain-driven flooding had claimed 20 lives and caused between 500 and 650 million euros in damages, according to France’s state-owned reinsurance company (CCR) which used another experimental platform of the laboratory for its estimates.
1
Slideshow mode
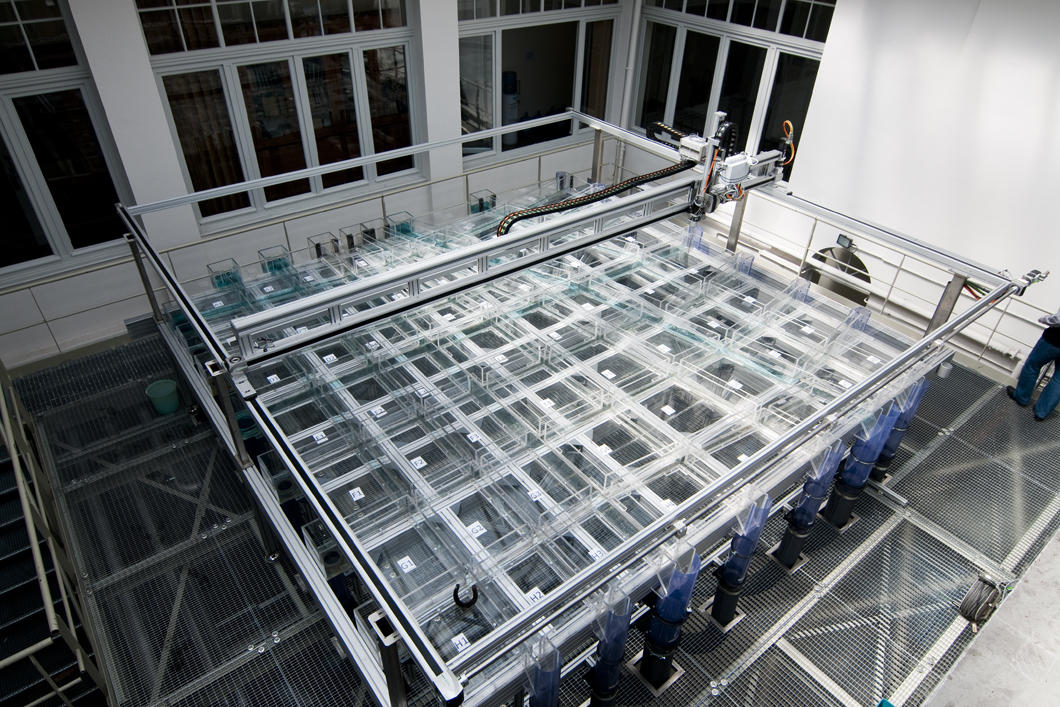
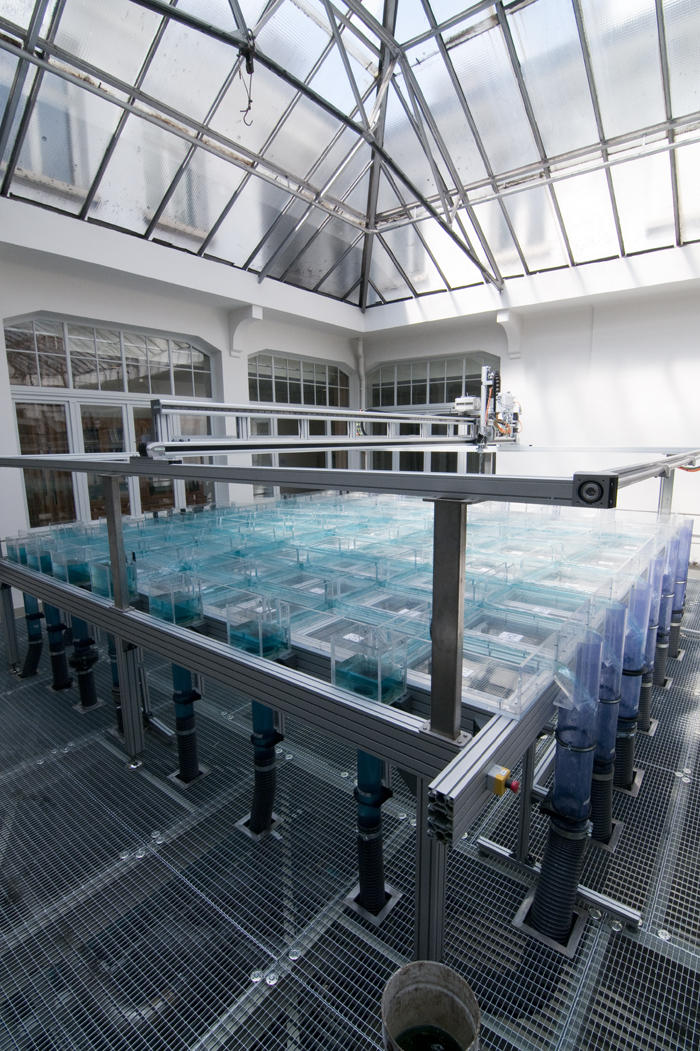
This 5 m x 5 m platform, which is unique in the world, replicates an urban district made up of 14 streets. The layout of these streets is not modeled on a real town.
CNRS Photothèque / Cyril FRESILLON
2
Slideshow mode
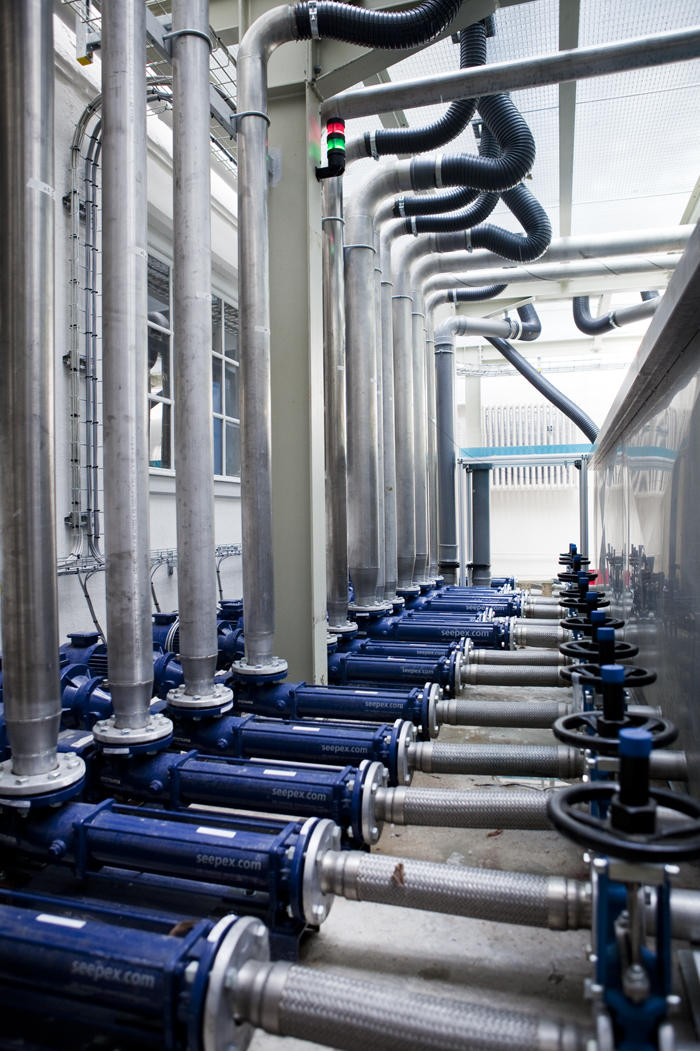
Each street is filled and controlled independently by a positive displacement pump whose output can reach up to 30 cubic meters per hour.
CNRS Photothèque / Cyril FRESILLON
3
Slideshow mode
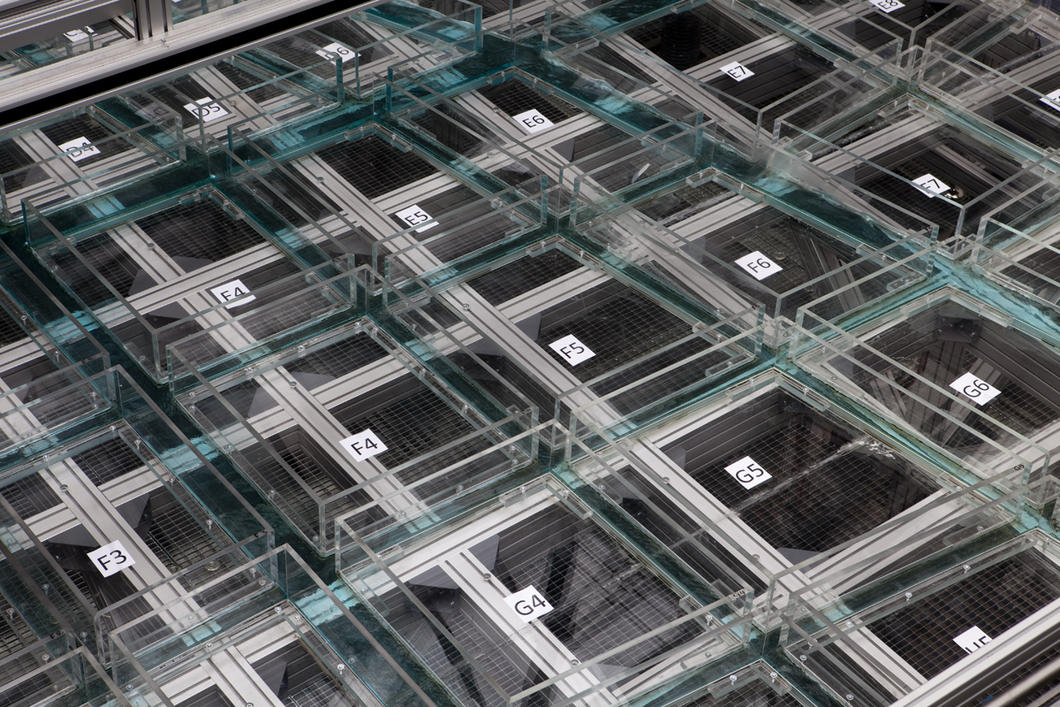
A number of parameters were taken into account when designing this platform, so as to be able to simulate the largest number of flooding scenarios.
CNRS Photothèque / Cyril FRESILLON
4
Slideshow mode
The angle of intersections, the width and length of streets or the way water is circumscribed are just a few of these parameters. They affect how water spreads during urban floods.
CNRS Photothèque / Cyril FRESILLON

5
Slideshow mode
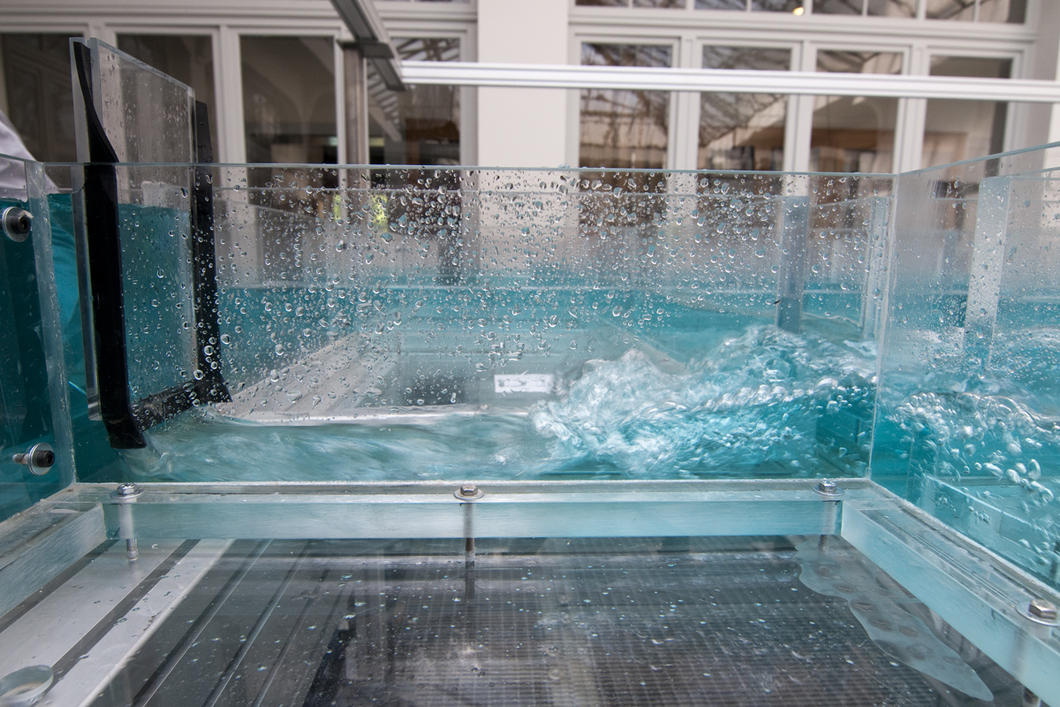
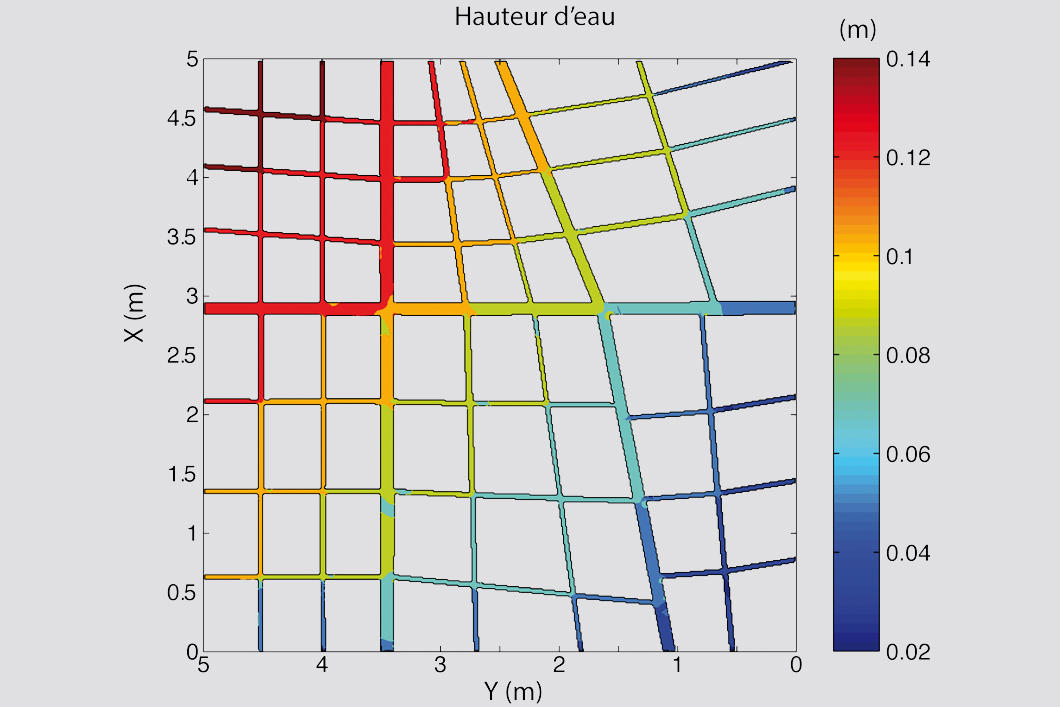
Defined by the level (height) of the water and its speed, flow within a city center is a complex phenomenon that can vary significantly depending on the exact surroundings. It differs from street to street, even if these intersect.
CNRS Photothèque / Cyril FRESILLON
6
Slideshow mode
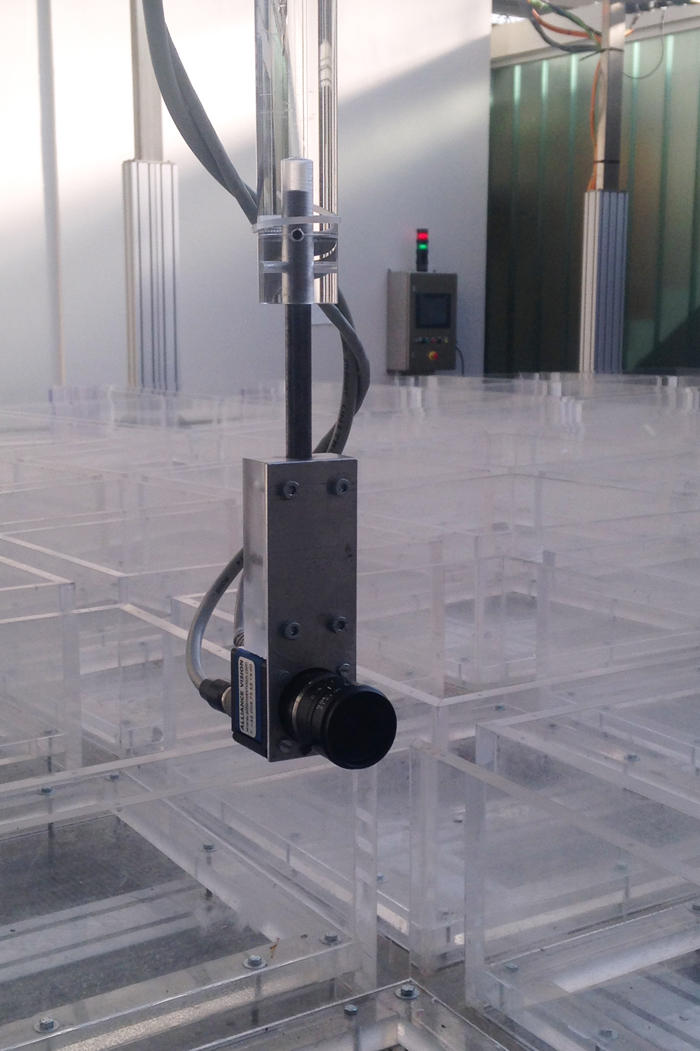
Modeling the flow is key to predicting damages caused by extreme flooding and anticipate its indirect consequences, such as water infiltration in a power transformer, for example.
CNRS Photothèque / Cyril FRESILLON
7
Slideshow mode
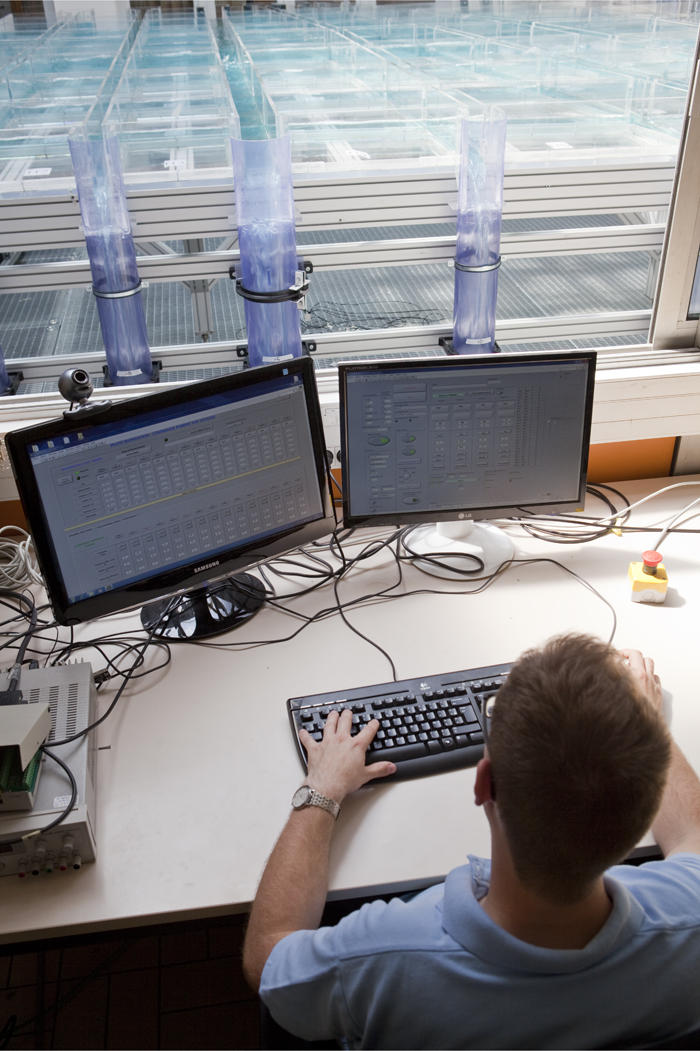
Many instruments are on the platform to monitor the various speeds, flow rates, water levels, including four high-speed cameras, many webcams, 15 ultrasonic sensors, and a Doppler velocimeter.
ICube / Pascal FINAUD -GUYOT

8
Slideshow mode
At the end of each “street,” a spillway determines the rate of flow with an ultrasonic sensor. This flow rate is a key parameter that needs to be taken into account during extreme flooding.
CNRS Photothèque / Cyril FRESILLON
9
Slideshow mode
Using the data collected from using the platform, the researchers are developing an extreme flooding simulation software that, unlike existing ones, is specifically tailored for urban areas.
CNRS Photothèque / Cyril FRESILLON
10
Slideshow mode
This map showing water levels in the various streets is established by software developed at the laboratory. The large data sets collected make it possible to create more accurate and reliable models than those from existing software.
ICube
11
Slideshow mode
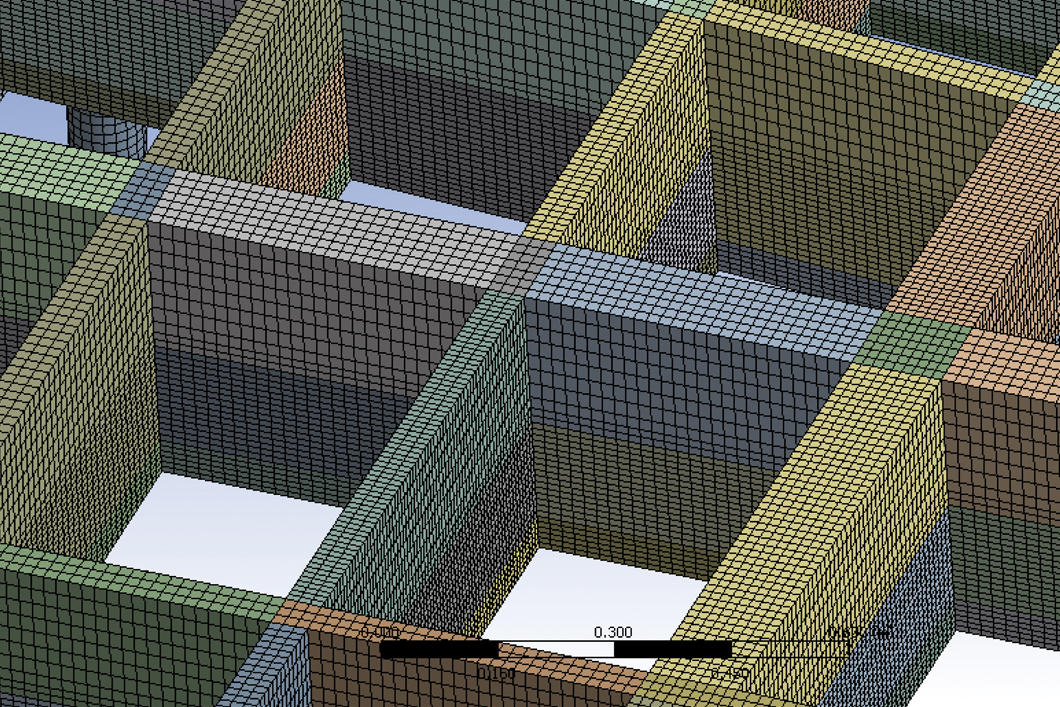
This 3D mesh shows the large number of computational data that needs to be included to elaborate these complex models. The Flood Risk Prevention Plans (PPRI) set up using these instruments will be more efficient.
ICube

12
Slideshow mode
The PPRIs are used by the French government to better anticipate the damages that could result from floods, including another “Great Flood of Paris” (since the last one occurred in 1910).
CNRS Photothèque / Cyril FRESILLON

13
Slideshow mode
Climate change is believed to intensify extreme flooding events. Anticipating the risk associated with these floods has therefore become a crucial objective.
CNRS Photothèque / Cyril FRESILLON
Explore more
Matter
Article
10/27/2025
Slideshow
07/17/2025
Article
07/07/2025
Article
03/26/2025
Slideshow
03/19/2025
Physics
Article
07/07/2025
Slideshow
03/19/2025
Article
01/14/2025
Article
04/09/2024
Article
01/24/2024
Flooding
Article
12/11/2023
Opinion
04/13/2022
Article
03/27/2017


