You are here
COVID-19: How Are Epidemic Models Designed?
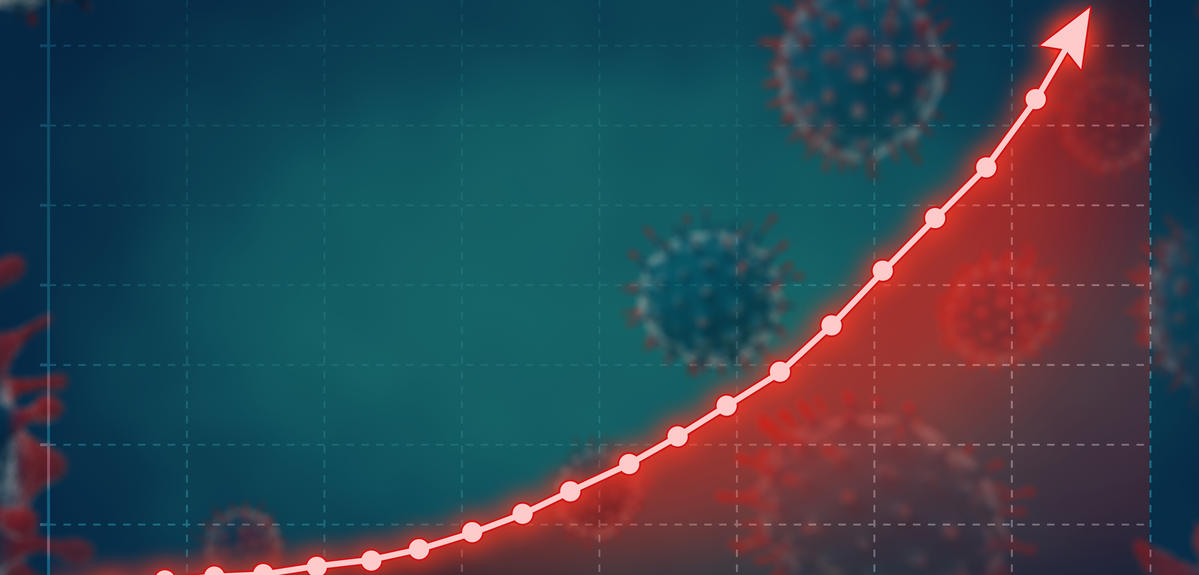
With the implementation of confinement measures, the COVID-19 epidemic is now affecting the entire French population and beyond. It is therefore impossible not to try and figure out how long this crisis will last, and how many victims it will claim. Different models and predictions are available, but how can such scientific and medical tools, which are not meant to enlighten the general public, be touched on? And how are they built?
“There are generally two types of epidemic model: those using aggregated data at the population scale and those involving distributed information at the individual level,” explains Éric Daudé, a geographer and research professor in the Laboratoire IDEES.1 They thus range from the more general, but practical, patterns applicable at large scales, to those that are very detailed but only apply to a highly specific context. The models being developed for COVID-19 are of the former type, where differential equations describe evolution in the status of four types of population: Healthy, Exposed, Infected and Recovered (HEIR).
Sizes in these groups change as a function of the dangerousness of the virus and the resources used to combat it. Contamination depends on three criteria: the number of contacts between healthy and infected individuals, the ease with which a pathogen can be transmitted during these contacts and the length of time patients remain contagious. According to the scenarios envisaged, this basic model can be fine-tuned by integrating population movements, differentiated exposures or age groups, etc. “These macroscopic models are quite parsimonious, or in other words they use few parameters that are gradually calibrated as knowledge of the disease improves,” explains Éric Daudé. However, they are based on highly simplified hypotheses.
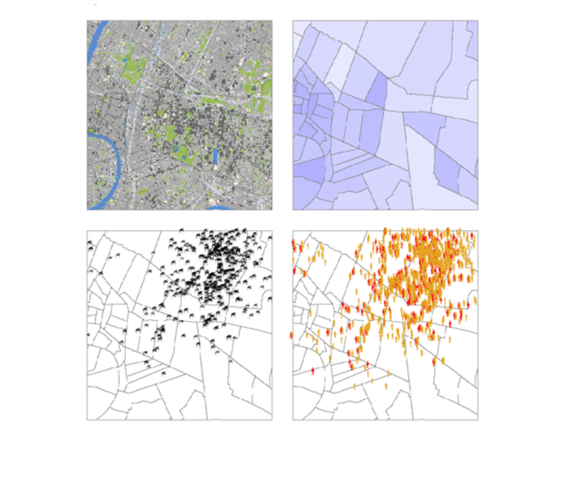
The second, distributed category abandons mathematical models of groups and resorts to IT approaches that describe individuals and behaviours. A more complicated method, it is preferred when environmental and social variations are determining factors in the emergence and spread of an infection, which happens to be the case of those transmitted by vectors like mosquitoes or ticks. Éric Daudé is actually specialised in diseases including dengue or chikungunya where models are able to guide pest control campaigns at the district or even street scale in vast and complex cities such as Delhi or Bangkok.


Models to deal with the unknown
Although modelling has been used for many years and proved its worth, its efficacy when dealing with a very poorly understood virus has not yet been established. “Epidemiology has the advantage of obeying the laws of physics,” insists Samuel Alizon, epidemiologist and research professor at the MIVEGEC laboratory.2 “We obtain data from weekly incidence curves for new cases, and contact monitoring provides the serial interval, in other words the time elapsing between the onset of symptoms in an individual and their emergence in those they have infected. In the middle of an epidemic, this parameter requires the detection of infecting and infected parties in the population.” The model is then calibrated by refining it with existing statistics and knowledge; for example, those drawn from the SARS outbreak in 2003, a coronavirus that also appeared in China.
During the early stages of an epidemic, stochastic models, i.e. those based on hazard, are privileged. Indeed, a small group of carriers will contaminate others in a highly random manner. As from that moment, the law of large numbers takes over and it can be considered that the contamination rate is the same for everyone. The scientists then turn to deterministic systems that can predict the appearance of peaks and gauge the effects of different control strategies. Typically, individual-centred models are stochastic, while population ones are generally more deterministic.
Models can also help to shed new light on a virus. By comparing predictions with field statistics, scientists can detect those parameters that explain potential differences. They can then deduce any information that would otherwise have escaped them, and refine their systems.
Lack of screening
“The greatest challenge is not so much to discover the mechanisms of spread but to understand the initial conditions of the epidemic,” explains Éric Daudé. “Even in projections covering less than two weeks, a difference of only a few percentage points in the population thought to be contaminated will produce very different results.” And the limited extent of screening in France is causing considerable uncertainty in this area.
During the past week, Samuel Alizon’s team has been focused on developing new models for COVID-19 in France, where these tools are lacking, particularly when compared to the UK. “They already have systems in place. All they need to do is change their parameters and let the machine run,” suggests the scientist. “We have no equivalent here and we must also measure the effects of confinement. It would indeed be much easier if a larger proportion of the population were being tested, instead of just observing the most severe cases.”
Tools derived from fundamental publications are however available to perfect simulations. Jean-Stéphane Dhersin, professor at the Université Sorbonne Paris Nord, member of the LAGA3 and deputy scientific director of the INSMI,4 specialises in highly theoretical mathematical models. Improvements to calculation power and data processing have made it possible to apply his findings and the researcher has gradually become interested in population genetics, and then epidemics.
The importance of R0
The mathematician simplified certain models, demonstrating that some accessible systems provided results that were sufficiently close to those of more difficult and complex tools. For example, the Bienaymé-Galton-Watson branching processes, originally designed to monitor… the survival of names in British nobility, is a stochastic method now used at the onset of an epidemic. “A person reproduces at a rate called R0, which becomes the average number of individuals infected by that person in the case of an outbreak,” details Jean-Stéphane Dhersin. “For COVID-19, this R0 value is currently around 2.5.” When R0 falls below 1, the disease is receding. This is what is happening at the moment in China. The R0 can be reduced by reinforcing herd immunity by means of vaccination, although at present this option is unfortunately not available for COVID-19.
Conversely, R0 enables a calculation of the herd immunity necessary for the epidemic to subside. “With the current R0 of 2.5, it would be necessary for 60% of the population to be infected,” deplores Jean-Stéphane Dhersin. “That is far too many.” A low R0 also means a lesser peak of cases that occurs later and is more spread out.
The scientist uses the example of the SARS outbreak in 2003. “The patients presented with symptoms just two or three days after being infected so they could be isolated rapidly. The R0 thus fell from 3 to less than 1. The epidemic thus stopped, and once all the cases had been brought under control, was not able to resume.”
The gradual and late appearance of symptoms in patients who were already contagious, and the existence of symptom-free carriers, probably explains today’s difficulties in controlling the disease. The early steps taken to lower the R0, based on those initiated for SARS, thus proved insufficient. “The aim is to reduce the R0 to stop the infection, or at least alleviate the healthcare system.” Yet Jean-Stéphane Dhersin also points out that the decision to apply one strategy or another is not purely scientific. These measures have a cost that is also social and economic, and may drive decision-makers to introduce them only gradually.
In these times of uncertainty and fake news, people naturally seek to obtain information on all the models available, but these are not necessarily meant to be understood by the general public. “What matters is to take account of the models’ sensitivity to hypotheses,” recommends Samuel Alizon. “Models always result from a simplification of reality, sometimes addressing several aspects at the same time. Attention must then be paid to the confidence intervals and not focus solely on the median.” Indeed, if it is predicted that 2% of infected individuals will die, but that the margin of error is even a mere percentage point, the final number will in fact vary between half more and half less.
- 1. Identité et Différenciation de l’Espace, de l’Environnement et des Sociétés (CNRS / Université Le Havre Normandie / Université de Caen Normandie / Université de Rouen Normandie).
- 2. Maladies Infectieuses et Vecteurs : Écologie, Génétique, Évolution et Contrôle (CNRS / IRD / Université de Montpellier).
- 3. Laboratoire Analyse, Géométrie et Applications (CNRS / Université Sorbonne Paris Nord).
- 4. CNRS National Institute for Mathematical Sciences and their Interactions.
Explore more
Author
A graduate from the School of Journalism in Lille, Martin Koppe has worked for a number of publications including Dossiers d’archéologie, Science et Vie Junior and La Recherche, as well the website Maxisciences.com. He also holds degrees in art history, archaeometry, and epistemology.


