You are here
Why Some Cities Are Hotter than Others

From frying eggs on scorching sidewalks to Marilyn Monroe’s provocative screen persona cooling off over New York’s draughty subway grates, city heat is the stuff of legends. But these warmer temperatures can also have very real—and unwanted—consequences on urban dwellers. To better understand the mechanisms that make the built-up core of cities warmer than their suburbs—a phenomenon known as Urban Heat Islands (UHI)—researchers from the MIT-based <MSE>21 lab, the LPTMS,2 and the University of California at Irvine teamed up to investigate why nighttime UHI effects are more intense in some cities than others. Their results, recently published in Physical Review Letters,3 shows a clear link between nocturnal temperatures and city layout.
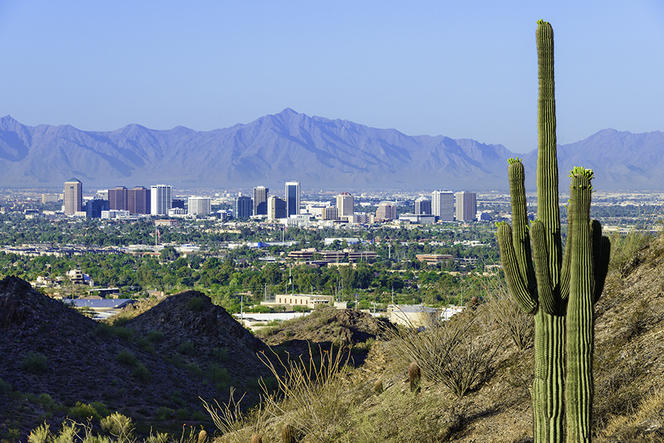
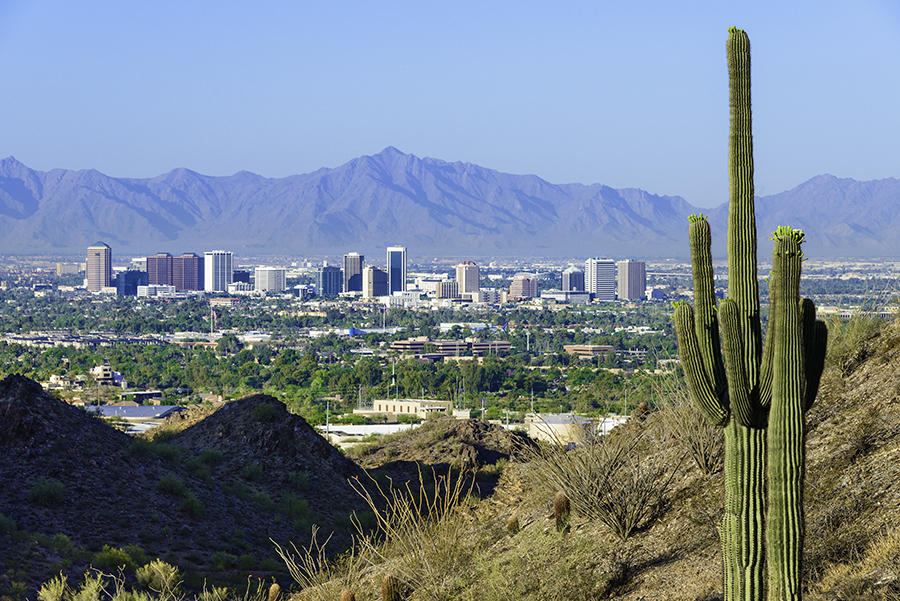
The concept of Urban Heat Islands is not new. Although the term was coined in the mid 20th century by a British climatologist called Gordon Manley,4 first reports of a contrast between the “artificial warmth” of London and the countryside go back 200 years.5 Indeed, UHIs primarily result from the transformation of rural into urban landscapes. Most critically of all, natural vegetation is replaced by building materials—namely concrete and asphalt—which absorb more thermal and solar energy. The UHI effect is most striking at night when less urbanized areas tend to cool off while city building materials radiate the energy soaked up during the day, mainly generated by solar radiation and human activities including industry, refrigeration and driving. Further intensifying the urban-heating effect, tall buildings block cooling wind while centers lack the plant cover that could otherwise create shade and release moisture into the air. This combination of factors hikes up city temperatures, sometimes radically. “We’re talking about temperature differences that range from 1.5 to 5°C on average, but the record goes to Phoenix, Arizona with a difference of nearly 10°C between its center and its outskirts,” explains the study’s co-author Roland Pellenq, a CNRS and MIT researcher who heads the international joint research laboratory <MSE>2.
The trouble is that UHIs can also cause health problems, worsen pollution, as well as intensify energy use. On this last point, Pellenq cites the example of Florida where “UHIs are responsible for $400 million being spent per year on energy overconsumption for air conditioning, which translates to the release of an extra 2500 tons of CO2 into the atmosphere.” But UHIs are not always bad news. “Massachusetts, for example, saves $200 million a year on heating, or the equivalent of 1200 tons of CO2,” he adds.
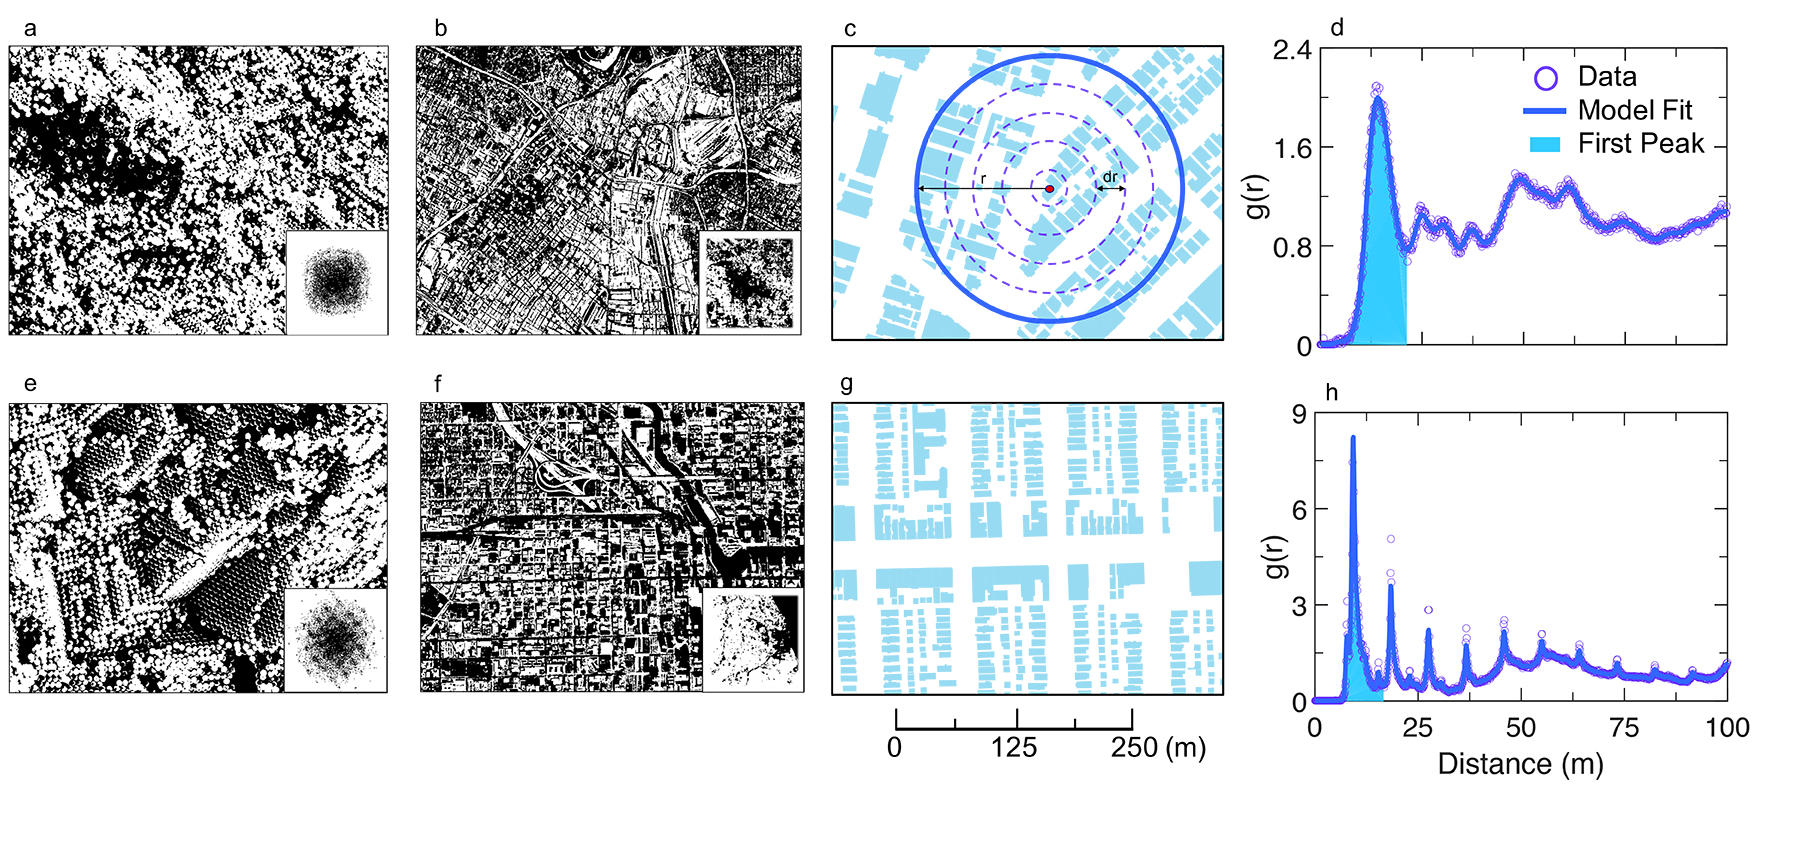
Yet one thing in particular has always eluded scientists. Why are some city centers hotter at night than others? For their study, Pellenq and his colleagues focused on “texture:” the patterns created by street and building layout, never previously considered on a citywide level. To determine the textures of 51 sample cities (mainly in North America but also New Zealand, Australia, the UK, Germany, Austria, the Netherlands and Sweden), the team fed building-position data gleaned from Internet sources, namely Google Maps, into algorithms that they adapted from statistical physics, traditionally used to describe how atoms are arranged within materials. “The idea was to reduce urban complexity into an average cluster representing a building’s immediate neighbors,” explains Pellenq, who came up with the approach with fellow <MSE>2 director Franz-Josef Ulm “during coffee breaks in the MIT courtyard while admiring the Boston skyline over the Charles River…” He indicates that most of the buildings covered in the study fall in “the residential sector, which makes up about half of the heating and cooling energy consumption in the US.”
From their calculations, the physicists created an index on how city layouts are organized, scaled from 0 (disorderly, like atoms in a liquid) to 1 (highly structured, like atoms in a crystal). Then, to gauge the intensity of UHI effects across the sample cities, the team referred to several years of temperature readings for each, compared with temperatures in an extra-city location, “generally the local airport,” Pellenq specifies.
Results revealed that “crystalline” cities—the case in much of North America, as exemplified by the grid-like layouts of Manhattan or Chicago—build up more heat than chaotic “liquid-like” cities such as London, typically older in construction, which shed heat more easily. This tendency is explained by the trapping of heat in straight, perpendicular streets where buildings reabsorb the heat radiated by others directly facing them. As the <MSE>2 director points out, “our work helps us understand which neighborhoods should be prioritized for implementing UHI-mitigation strategies.” The team also hopes to “extend this research to big European cities, and also study the evolution of UHIs over time by tracing the history of these cities’ growth.”
Looking to the future, the team’s findings offer new directions for city planners and officials aspiring to more energy-efficient cities. The upshot is that while grid layouts lead to overheating and wasted energy usage for air conditioning in hot climates, they are an asset in colder places that can do with extra warmth. “But that doesn’t mean we’re going to dismantle existing cities,” adds Pellenq. “The study shows that if we wish to lessen UHI effects, the way forward is for materials science and engineering to find better thermal-insulation solutions to reduce radiation and convective interaction between buildings.”
- 1. Multi-Scale Materials Science for Energy and Environment (CNRS / MIT / Aix-Marseille Université).
- 2. Laboratoire de Physique Théorique et Modèles Statistiques (CNRS / Université Paris Sud).
- 3. J.M. Sobstyl, T. Emig, M.J. Abdolhosseini Qomi, R. J.-M. Pellenq, and F.-J. Ulm, “Role of City Texture in Urban Heat Islands at Night Time,” Physical Review Letters, March 9, 2018.
- 4. G. Manley, “On the frequency of snowfall in metropolitan England,” Quarterly Journal of the Royal Meteorological Society, http://dx.doi.org/10.1002/qj.49708435910.
- 5. L. Howard, The Climate of London, vol. 1, first published in 1818.
Explore more
Author
As well as contributing to the CNRSNews, Fui Lee Luk is a freelance translator for various publishing houses and websites. She has a PhD in French literature (Paris III / University of Sydney).


